Convert your pre-existing Kpi documents
If you already are a user of our Kpi tool, you can upgrade your documents toward the new Kpi version. We recommend you this upgrade in order to enjoy the Kpi new features. All values that have been entered will be kept, only potential post-its could be lost (post-its are replaced by a more fitting annotation system). If you absolutely need to keep your post-its, you can keep using the old version of the Kpi.
In the case you have made the upgrade and you want to access the old version of your document, you can restore it from the deleted document page for 30 days.
Create a Kpi document
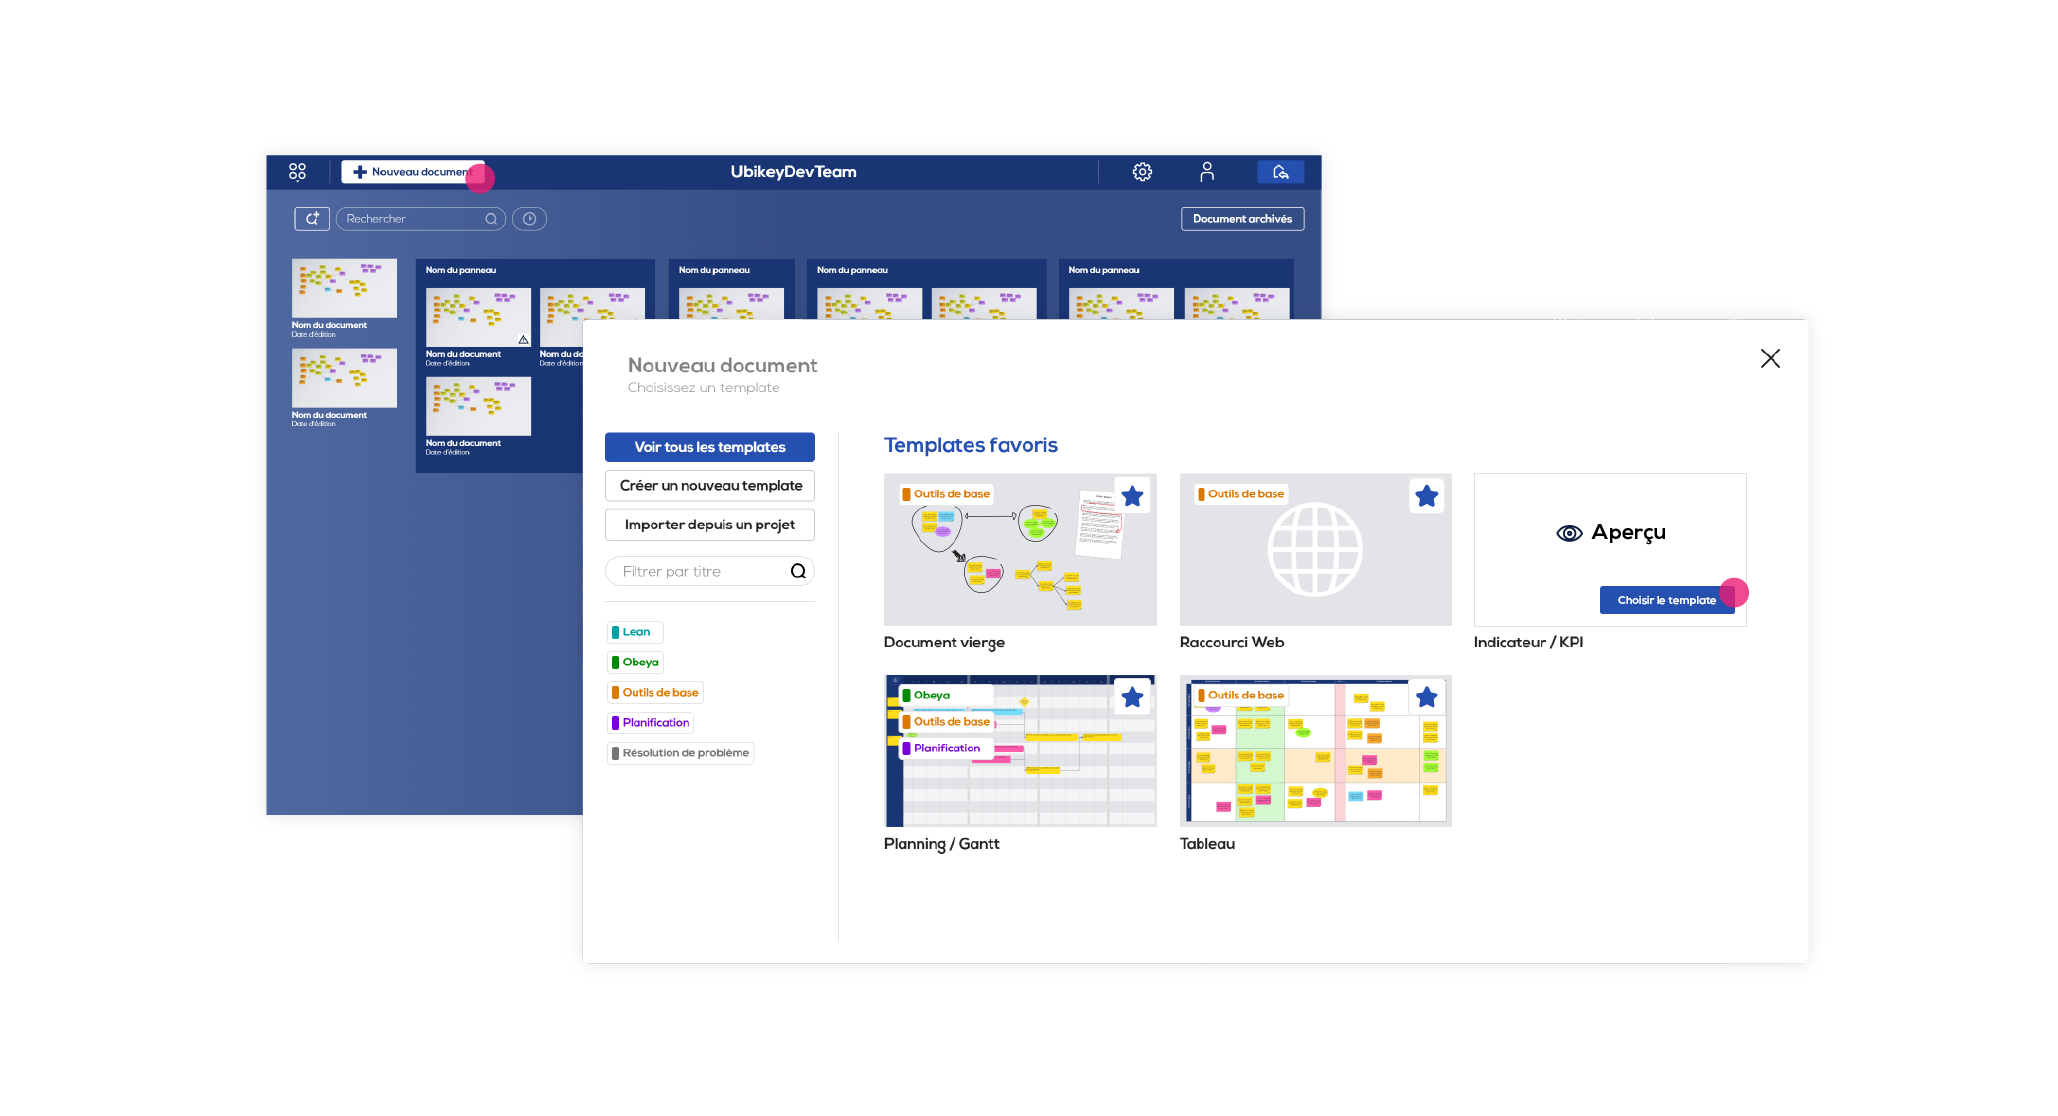
On the project home page, click on "New document" and place your cursor over the "Indicator/Kpi" tool thumbnail and click on "Choose template".
The settings window of your futur Kpi appears :
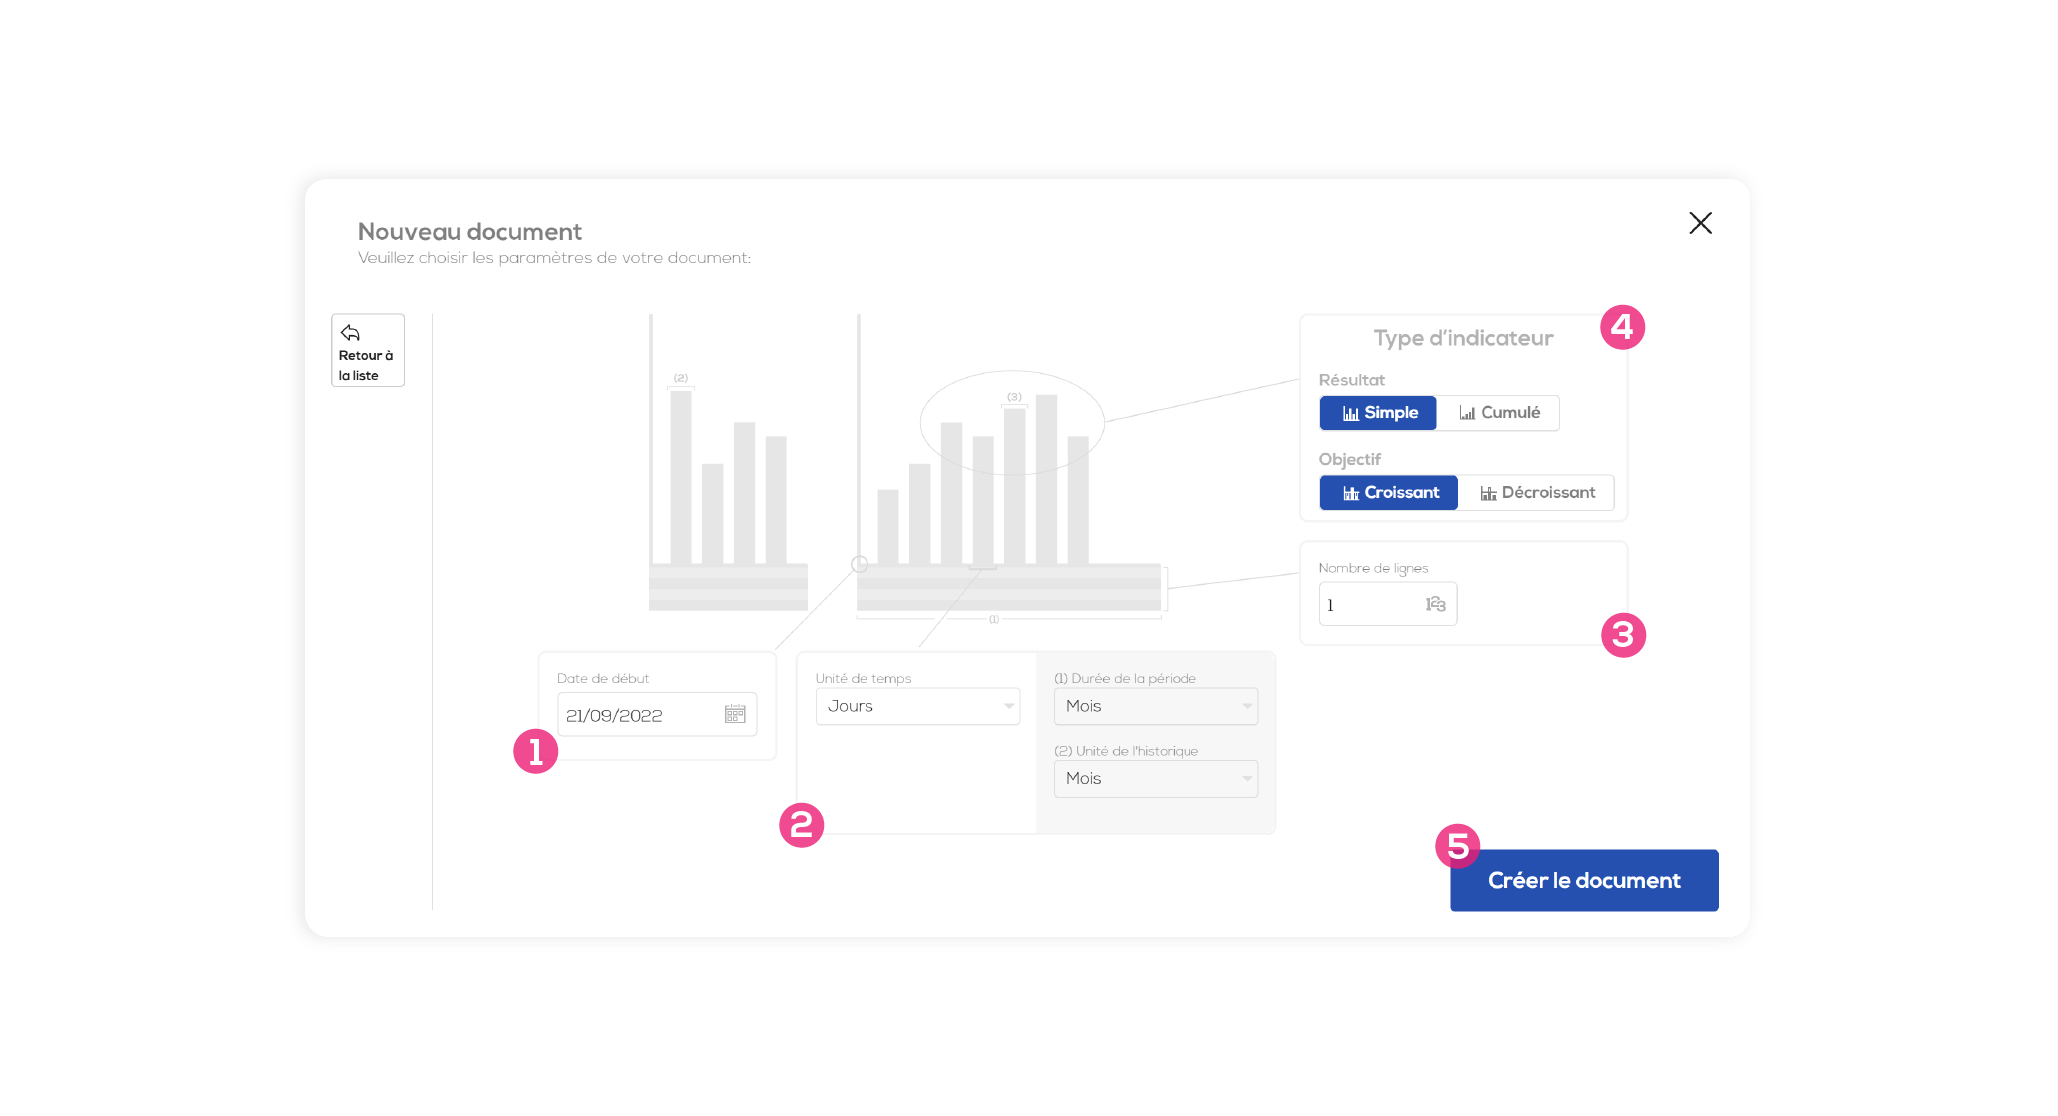
1 - Kpi start date (preset to the current date) : start date of the first period of your Kpi.
2 - Granularity of your Kpi :
Time unit -> granularity of your Kpi's monitoring,
Period duration -> duration for one page of your Kpi,
History unit -> granularity of the history part,
3 - Number of lines -> you can break the result down into different lines, the final result will then be the sum of the values entered in the differents lines.
4 - Indicator type (How the Kpi will be calculated and displayed).
Simple / cumulated result : for a simple result each column will be calculated independently while for a cumulated result, the result will be the sum of the period previous columns values and the current column value.
Increasing / decreasing objective (how will the values be displayed within the histogram) : for an increasing objective the result must be higher than the objective while for a decreasing objective the result must be lower than the objective.
5 - When your Kpi document is configured, click on "Create document".
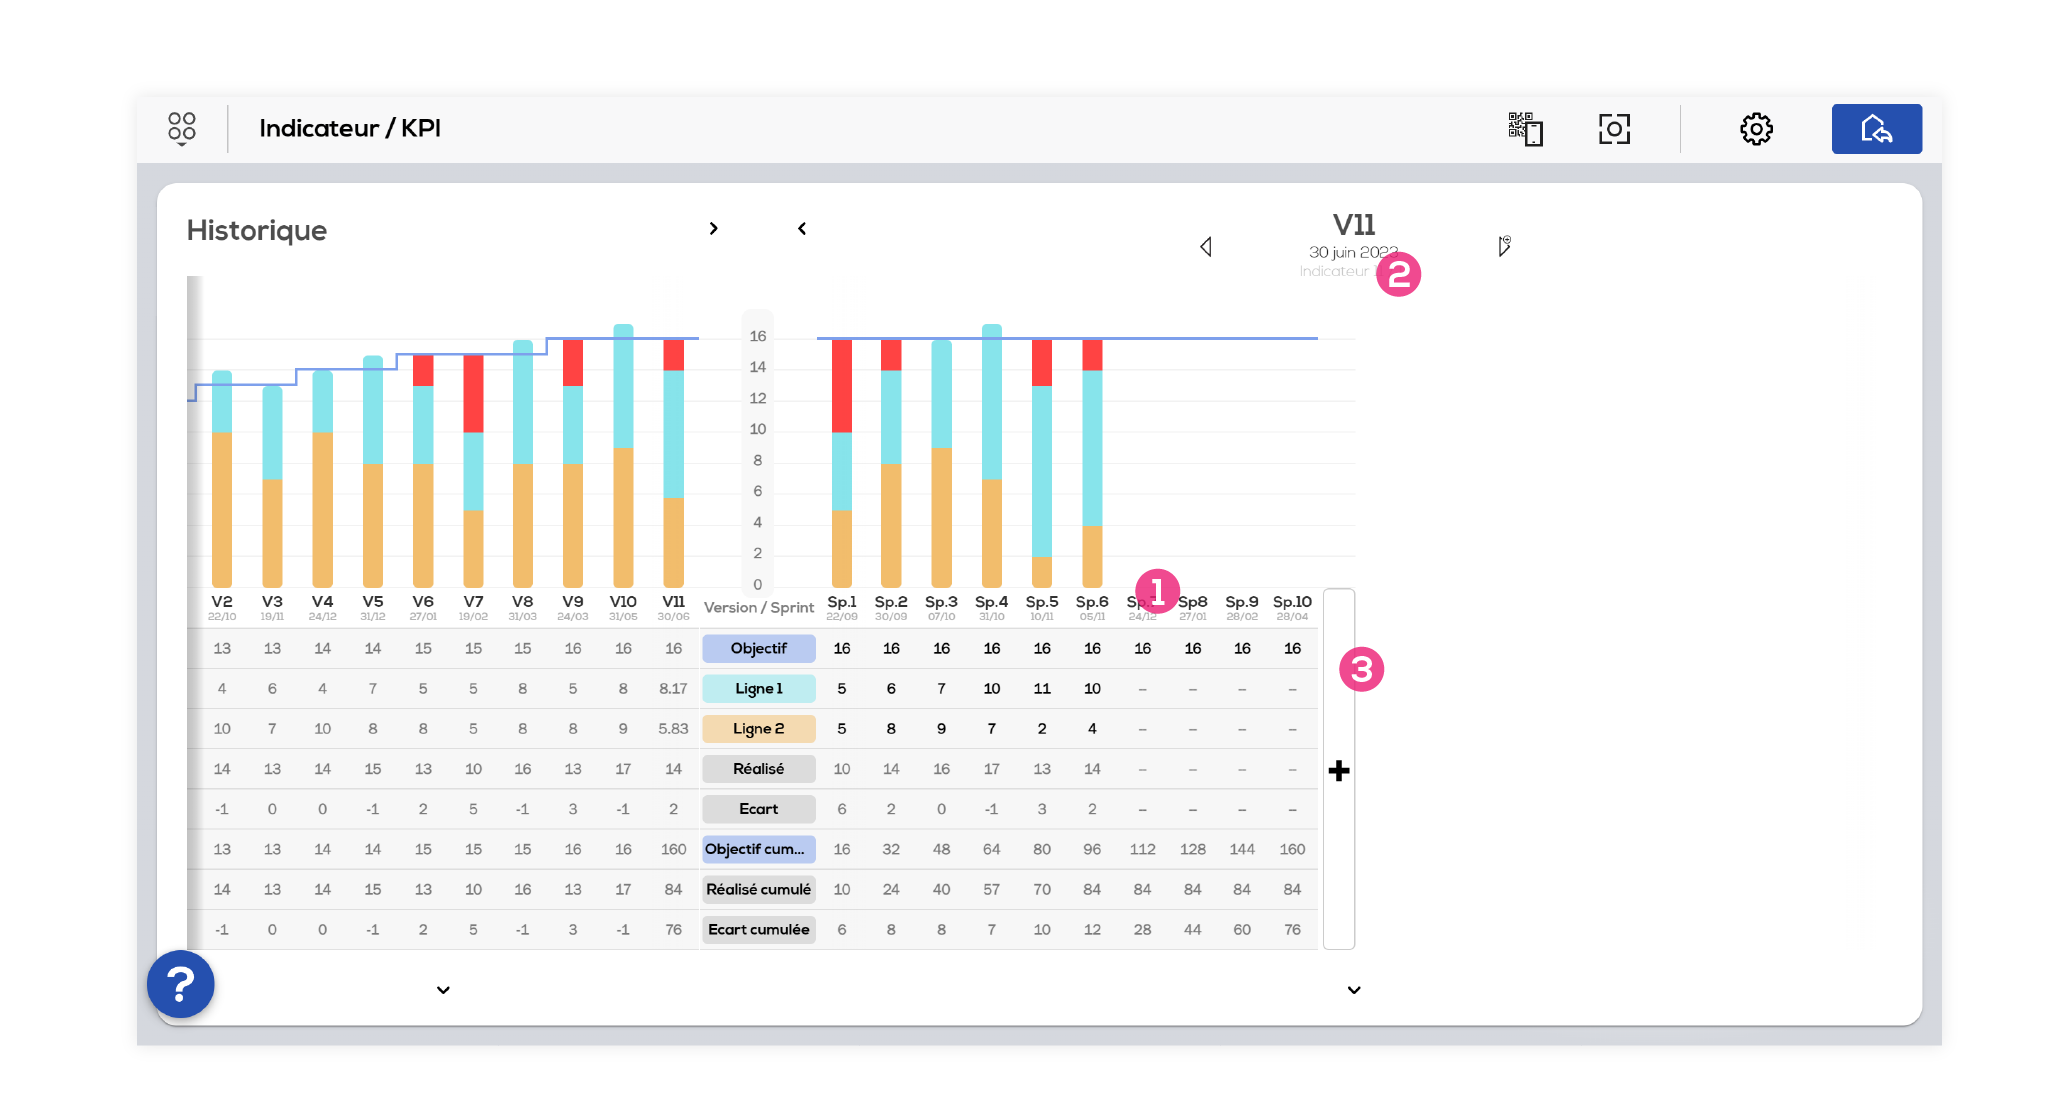
Edit your Kpi document

1 - Click on a cell to enter a value (only the objective and the lines making up the result are editable, the other lines are calculated from those lines).
2 - Click on a line header to edit the color and label of the line (see below). A right click will allow you to add or delete a line. You can also choose the lines order by holding click on the header and repositionning the line to the desired spot.
3 - Hide or display the values table.
4 - Display the period in full screen or display the history in full screen.
5 - Add a period or navigate among the differents periods of your Kpi.
6 - Place your cursor over a colum of the histogram to display the values details.
Edit a line
Click on a line header to display the line edition window.
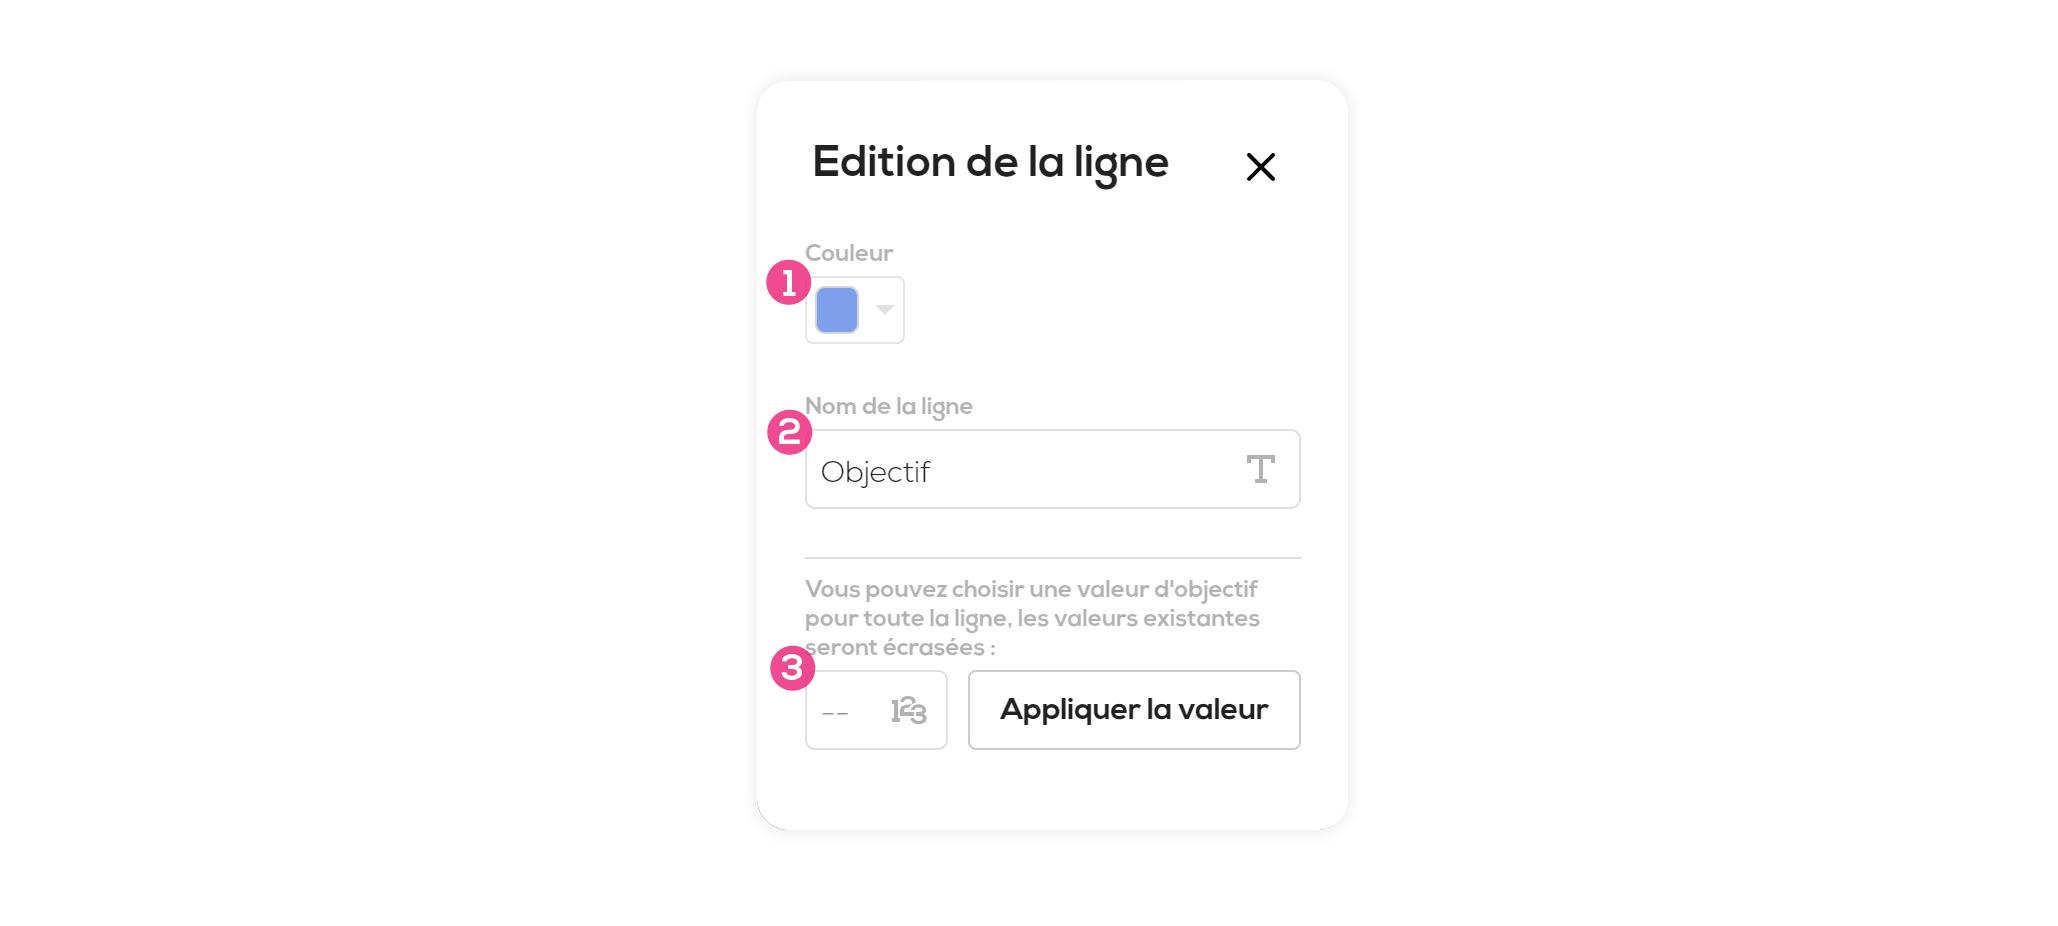
1 - Line color.
2 - Line name.
3 - (Only for the objective line) Apply the entered value to all the line cells of the period. Beware that if you already have entered values in this line they will be overwritten.
Custom units
This new version of the Kpi enable you to use custom units. For that, in your Kpi settings windows, choose "custom" in the "Time unit" dropdown menu.
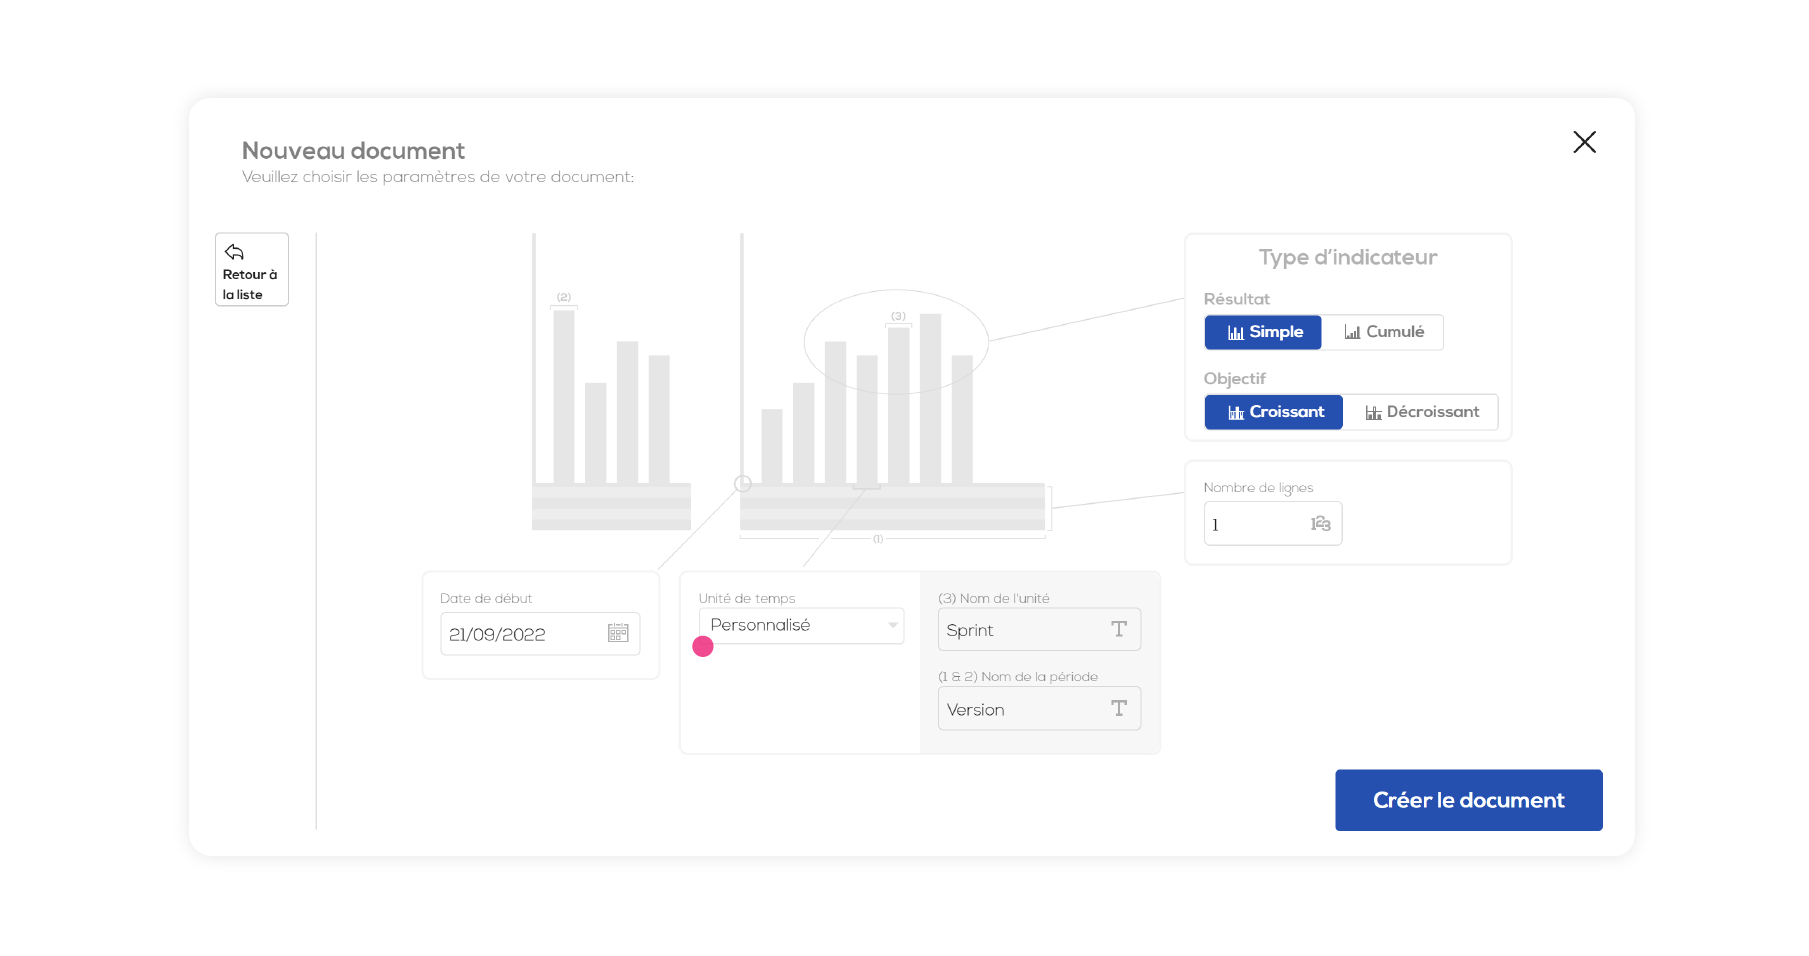
Two new parameters are then available : Unit name (one column of the period) and Period name (one page of your Kpi).
You can then choose directly in your document the number of column you want for a period.
In this configuration, each history column correspond with one period (each time you add a period, one corresponding history column is automatically created).
You can also, directly in your document, choose a name for each column and period.
Edit a custom unit Kpi
The custom unit Kpi's operation is overall the same as the "classic" Kpi. However they have a few additionnal features :
1 - Edit the column name and date.
2 - Edit the period name and date, those details will be displayed on the history columns headers (as a reminder, in this configuration one period correspond with one history column).
3 - Add column. To delete a column, right-click on the column header and choose "delete column".
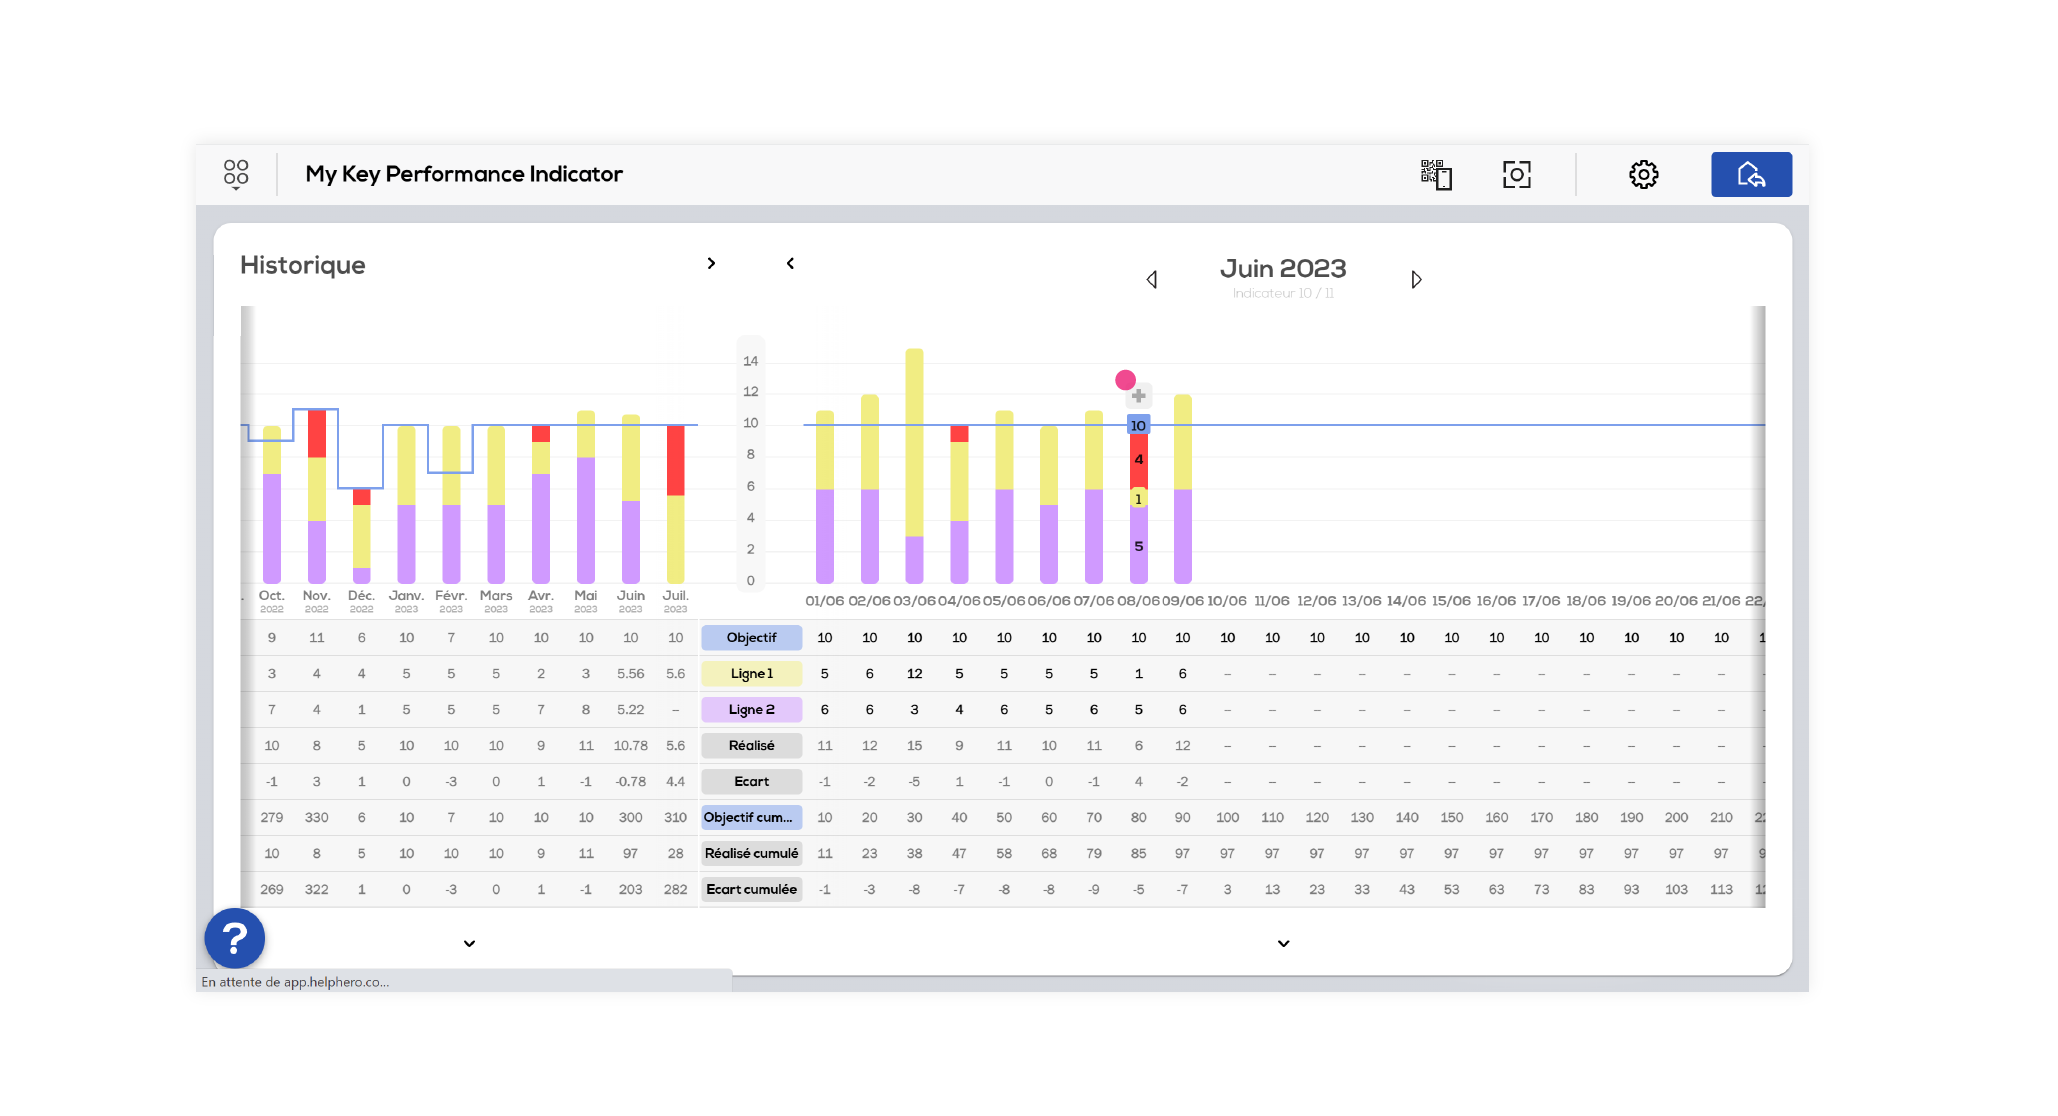
Annotations
Annotations enable you to comment your Kpi. Each annotation is linked to one column of one of your Kpi's period. To add an annotation, place your cursor over a column and click on the "add annotation" button.
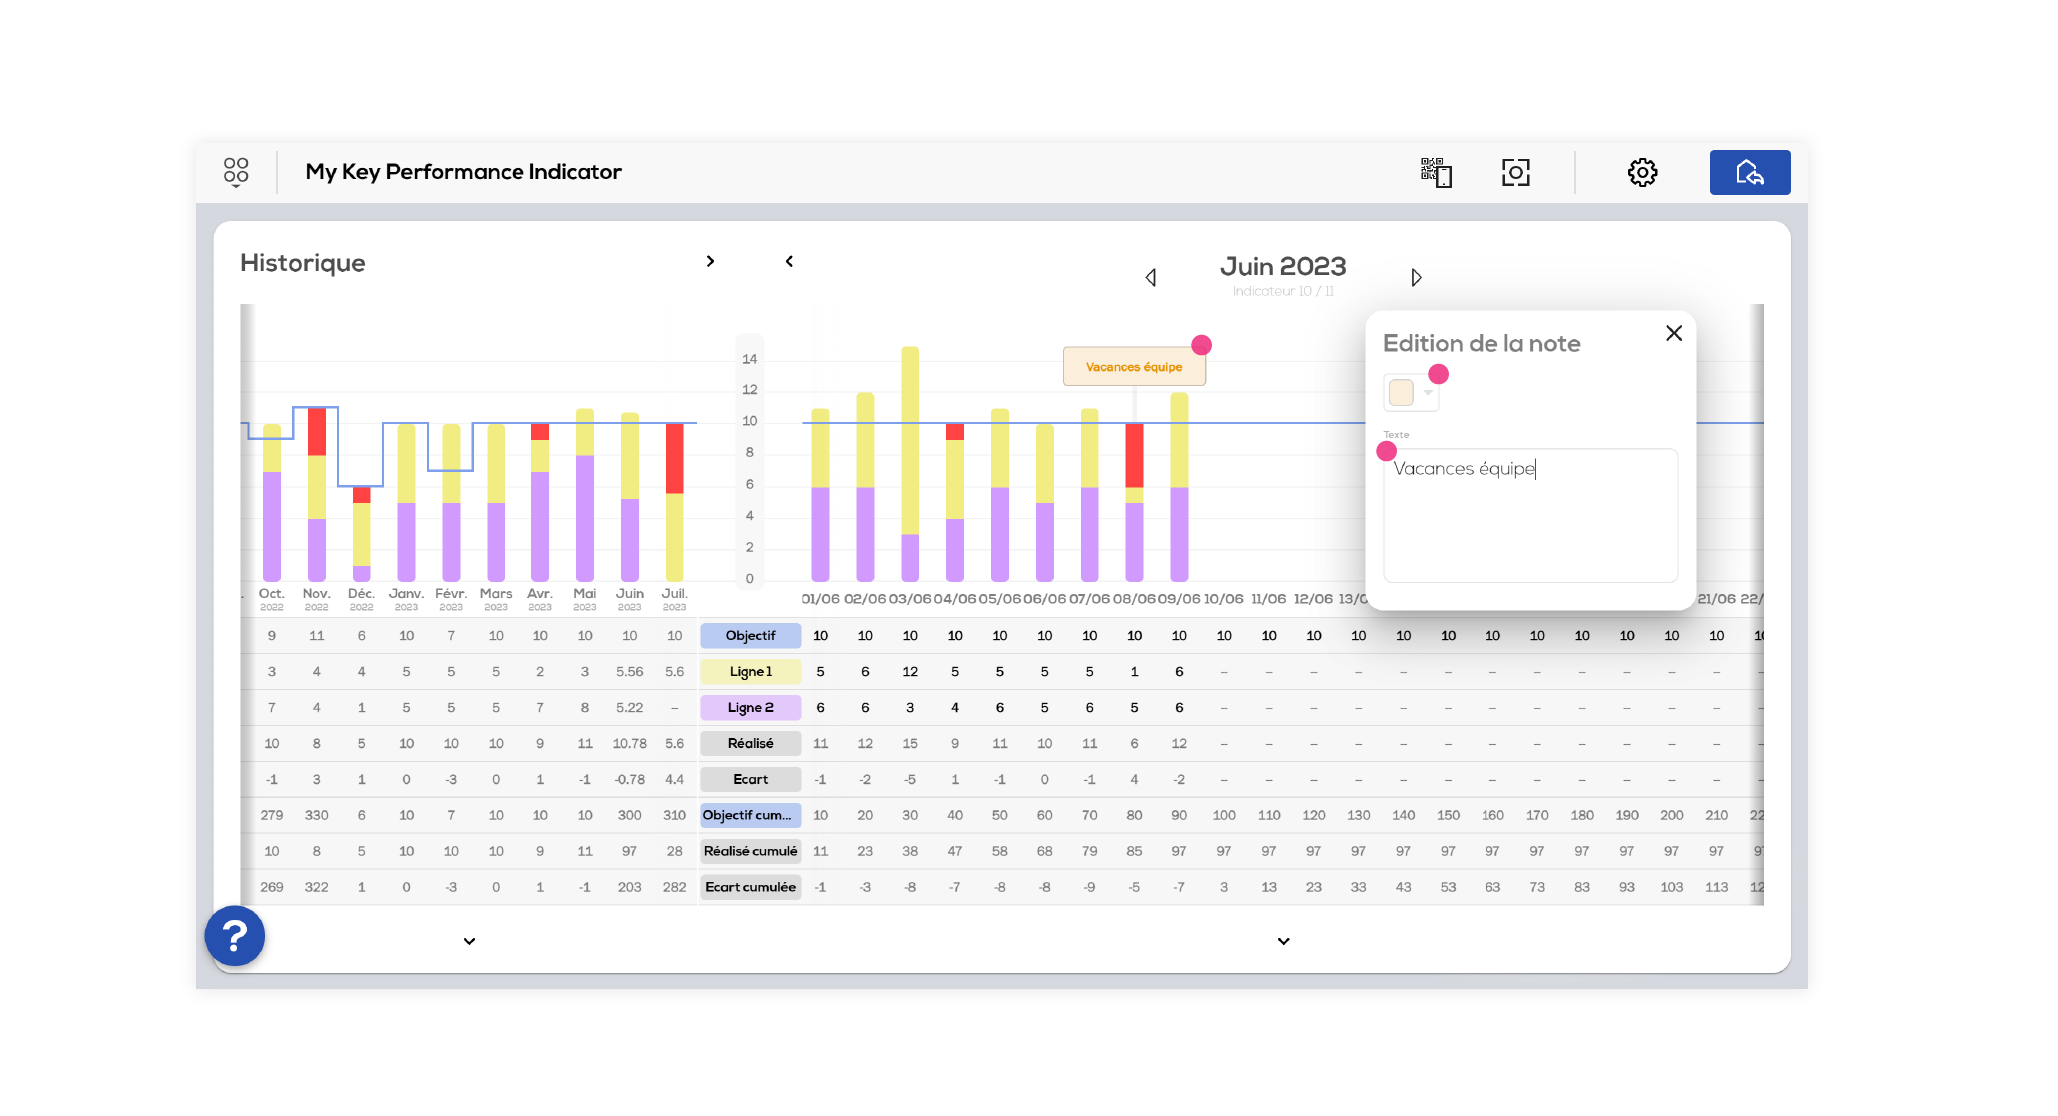
An annotation has been added to the column. You can choose a color and add text in the edition window.
You can move annotations vertically along the column. To edit an annotation, place your cursor over it and click on :
1 - Reduce annotation
2 - Add a new annotation
3 - Edit or delete the annotation
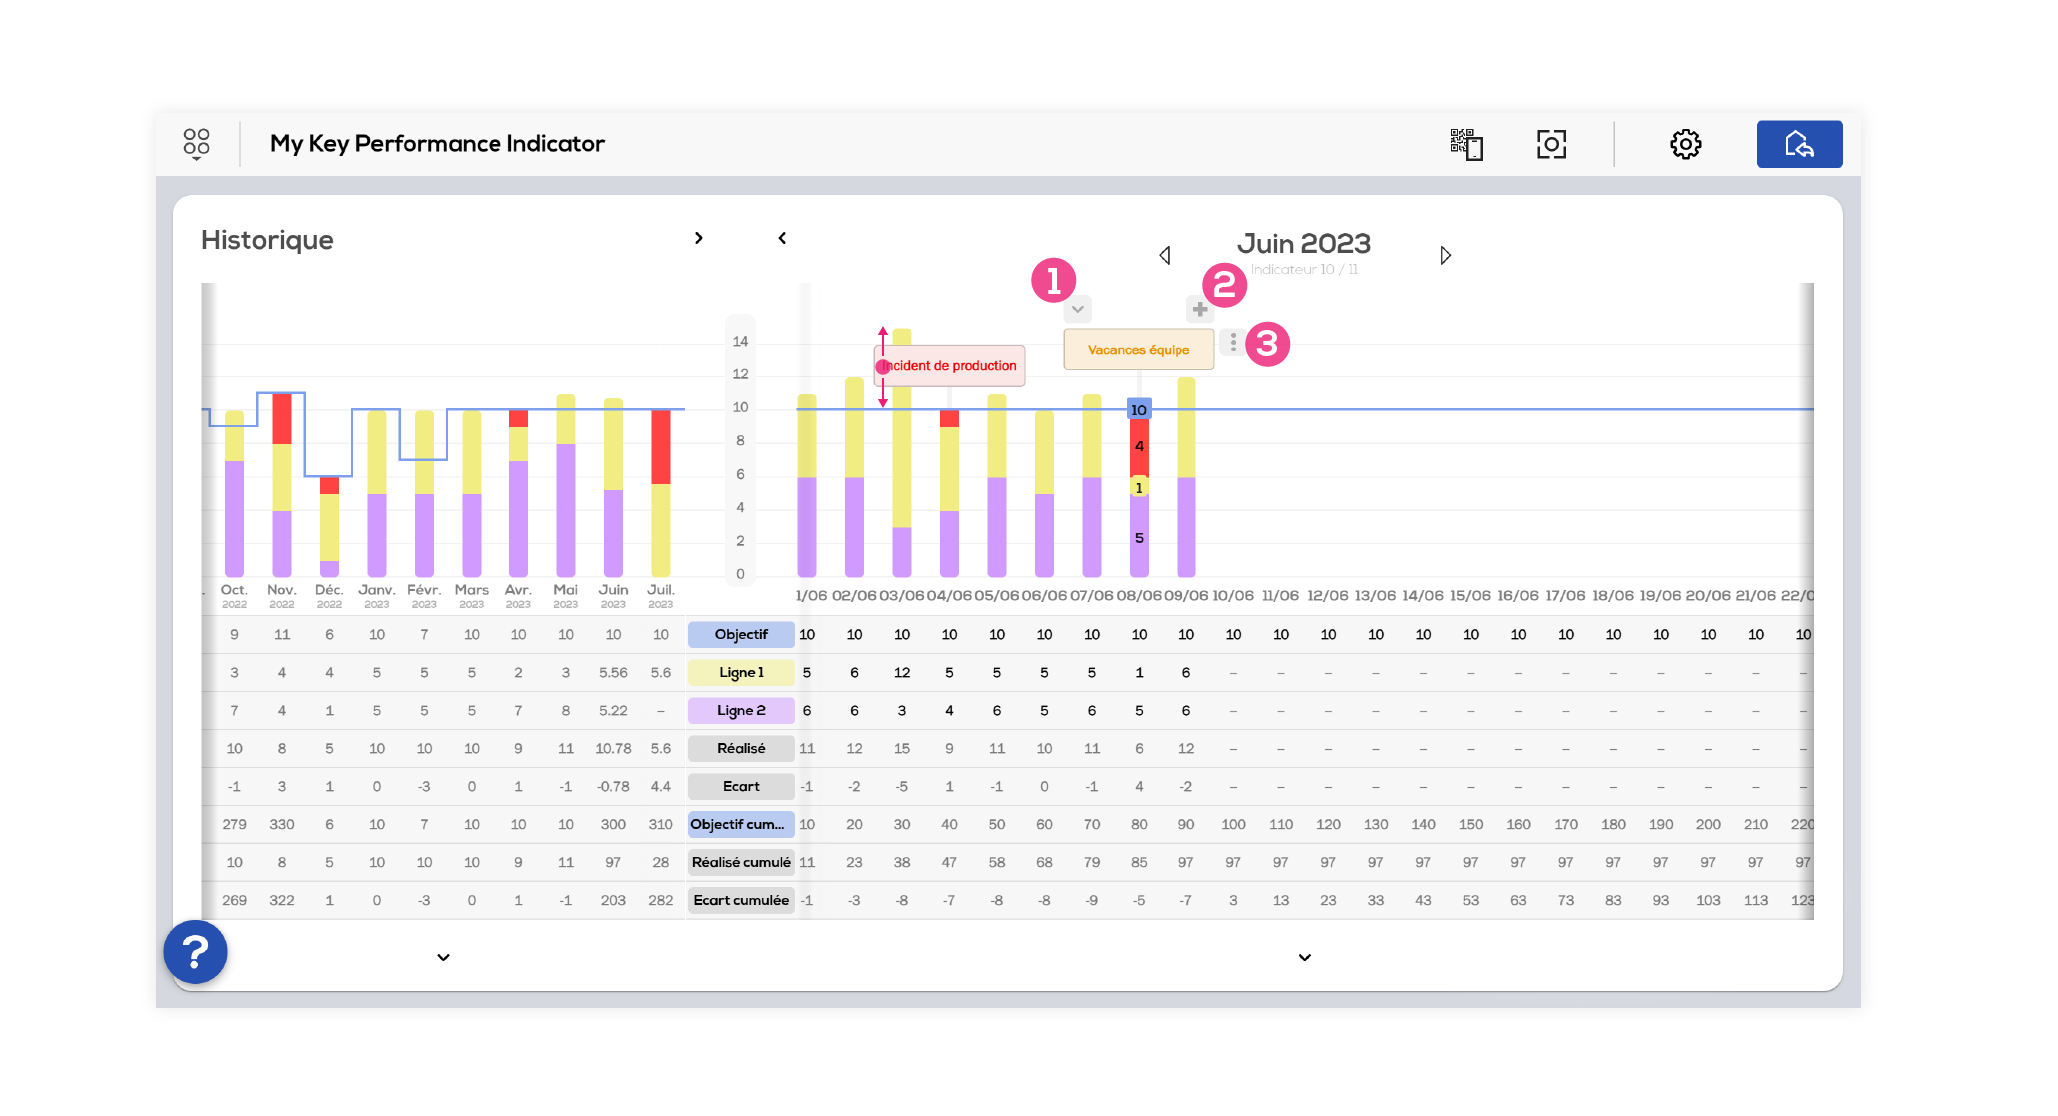
Tip 1 : Double click on an annotation to open the edition window.
Tip 2 : Right-click on an annotation to add an annotation, edit the annotation or delete the annotation.
Kpi's settings
Click on the "settings" icon on the upper right part of your screen to open the settings tab.
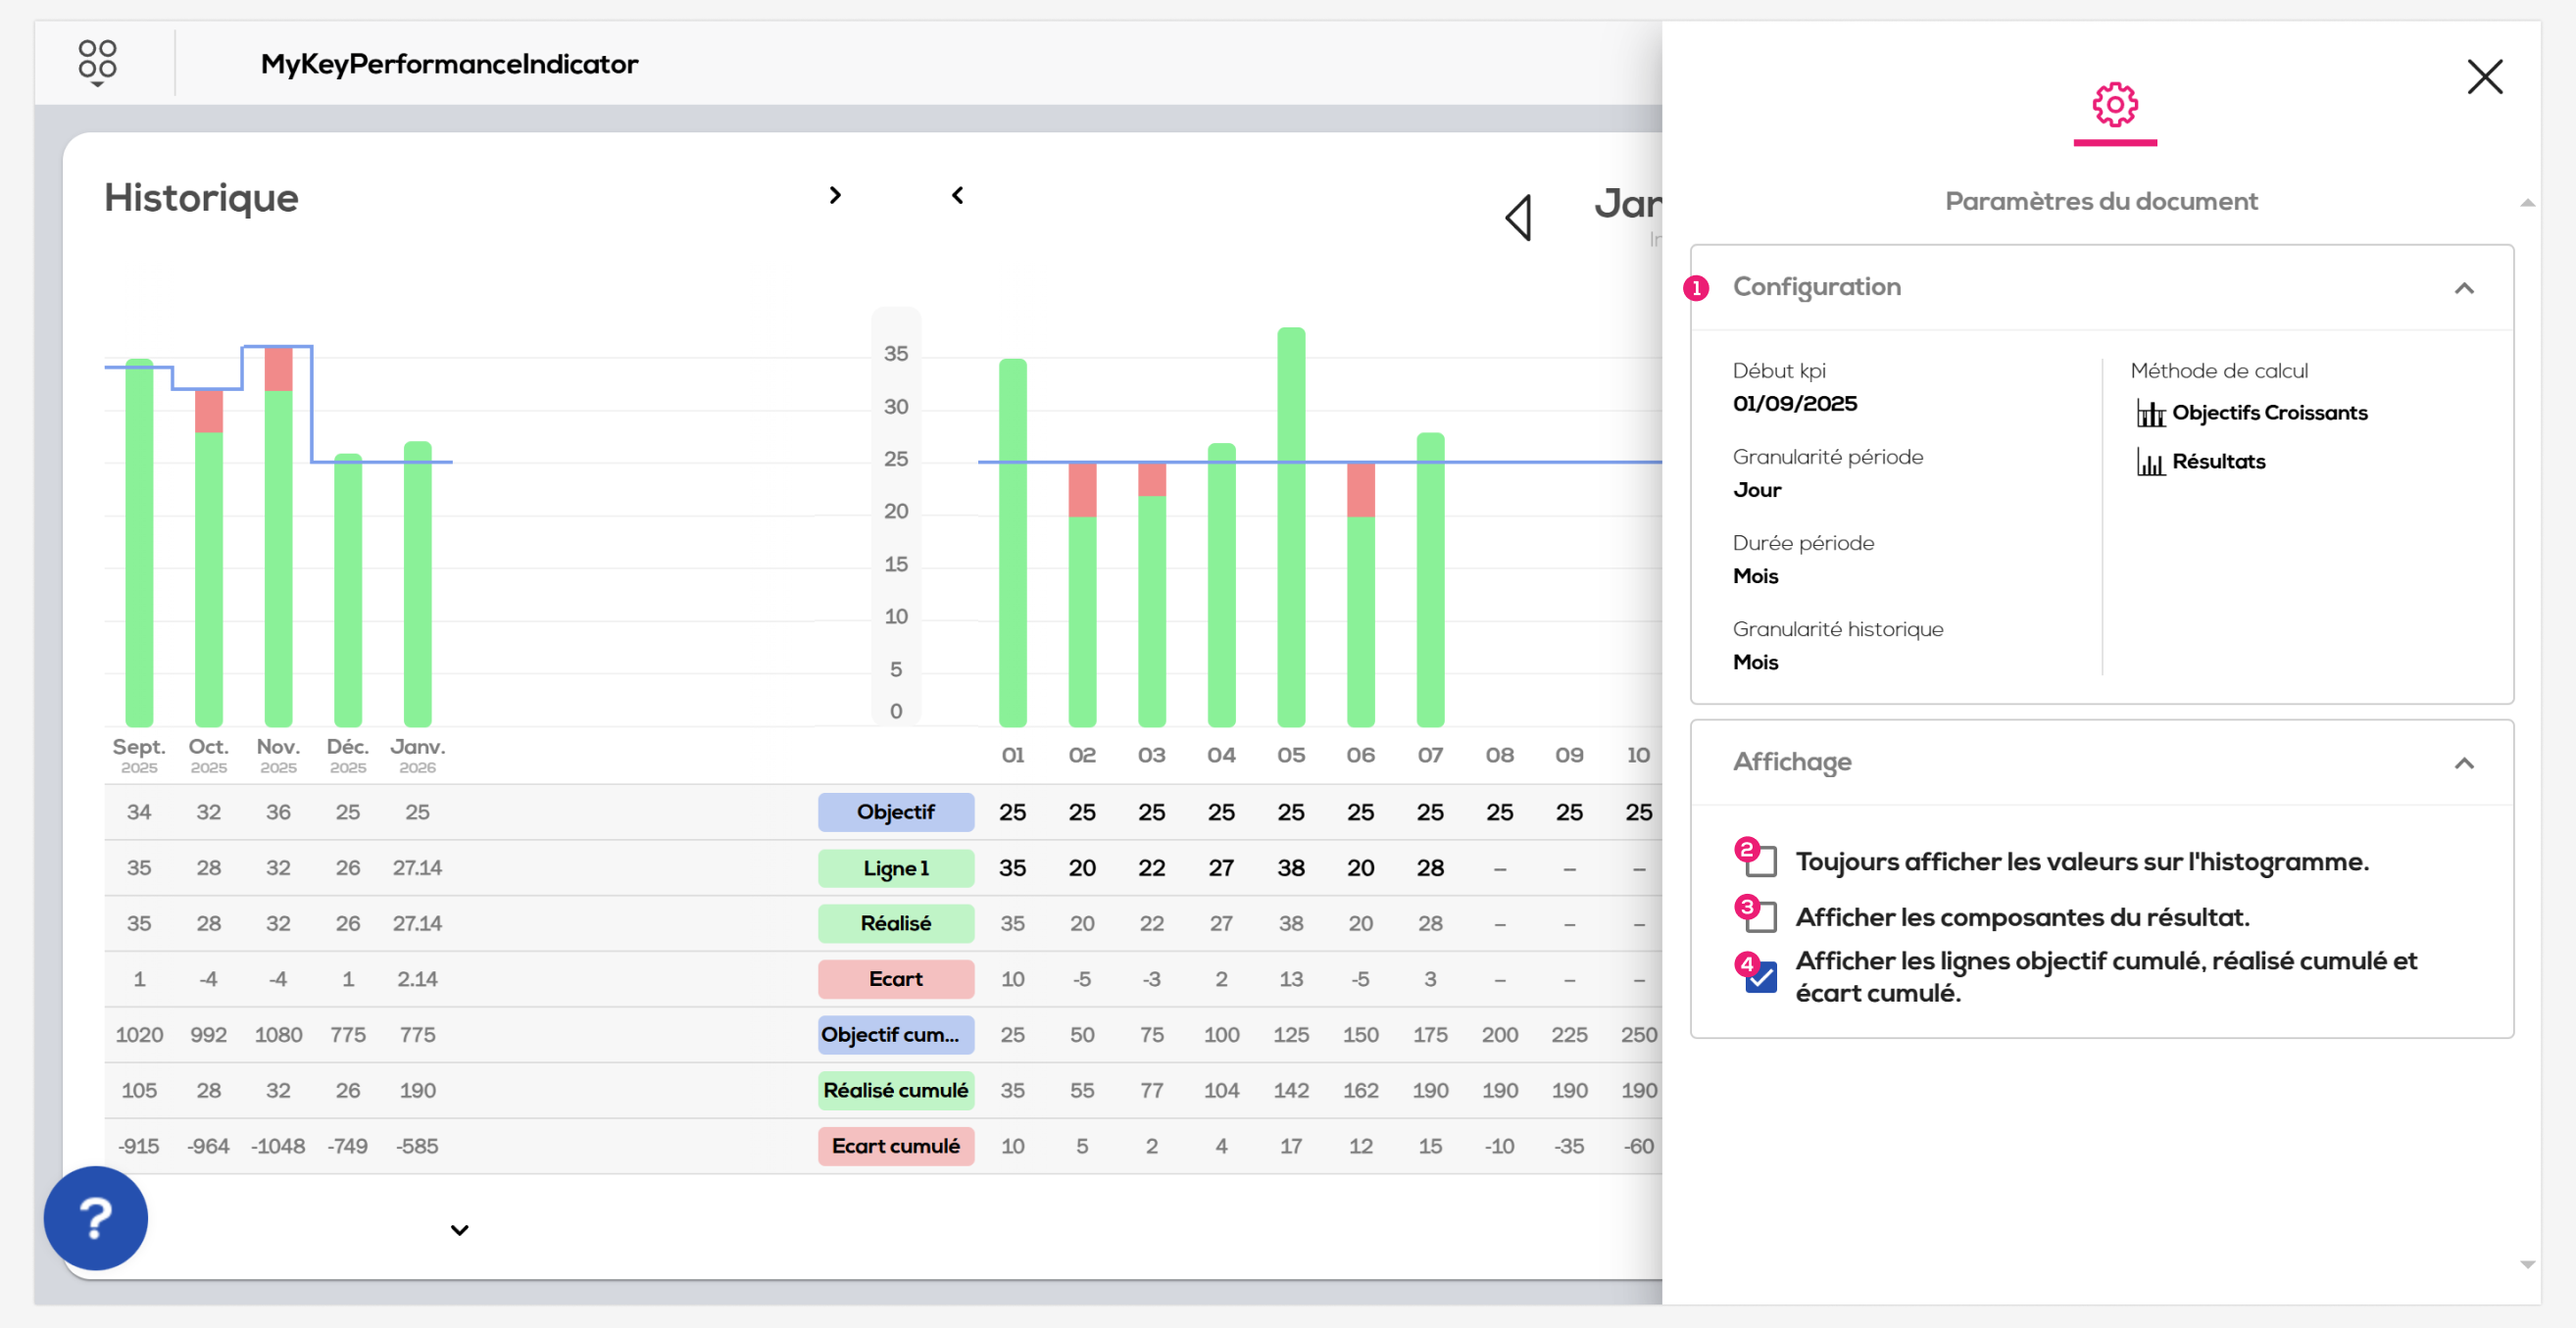
1 - Find here the configuration's details of your Kpi.
2 - This option enables you to always display the value on the histogram.
3 - This option enables you to display the different components (lines) of the result. It is activated by default for a new Kpi.
4 - Show / hide the cumulated lines in the table.