Indicators views
An indicator view is a visual representation of one or more indicators data (know more about indicators). It enables you to look at and edit your indicators values.
The weekly table
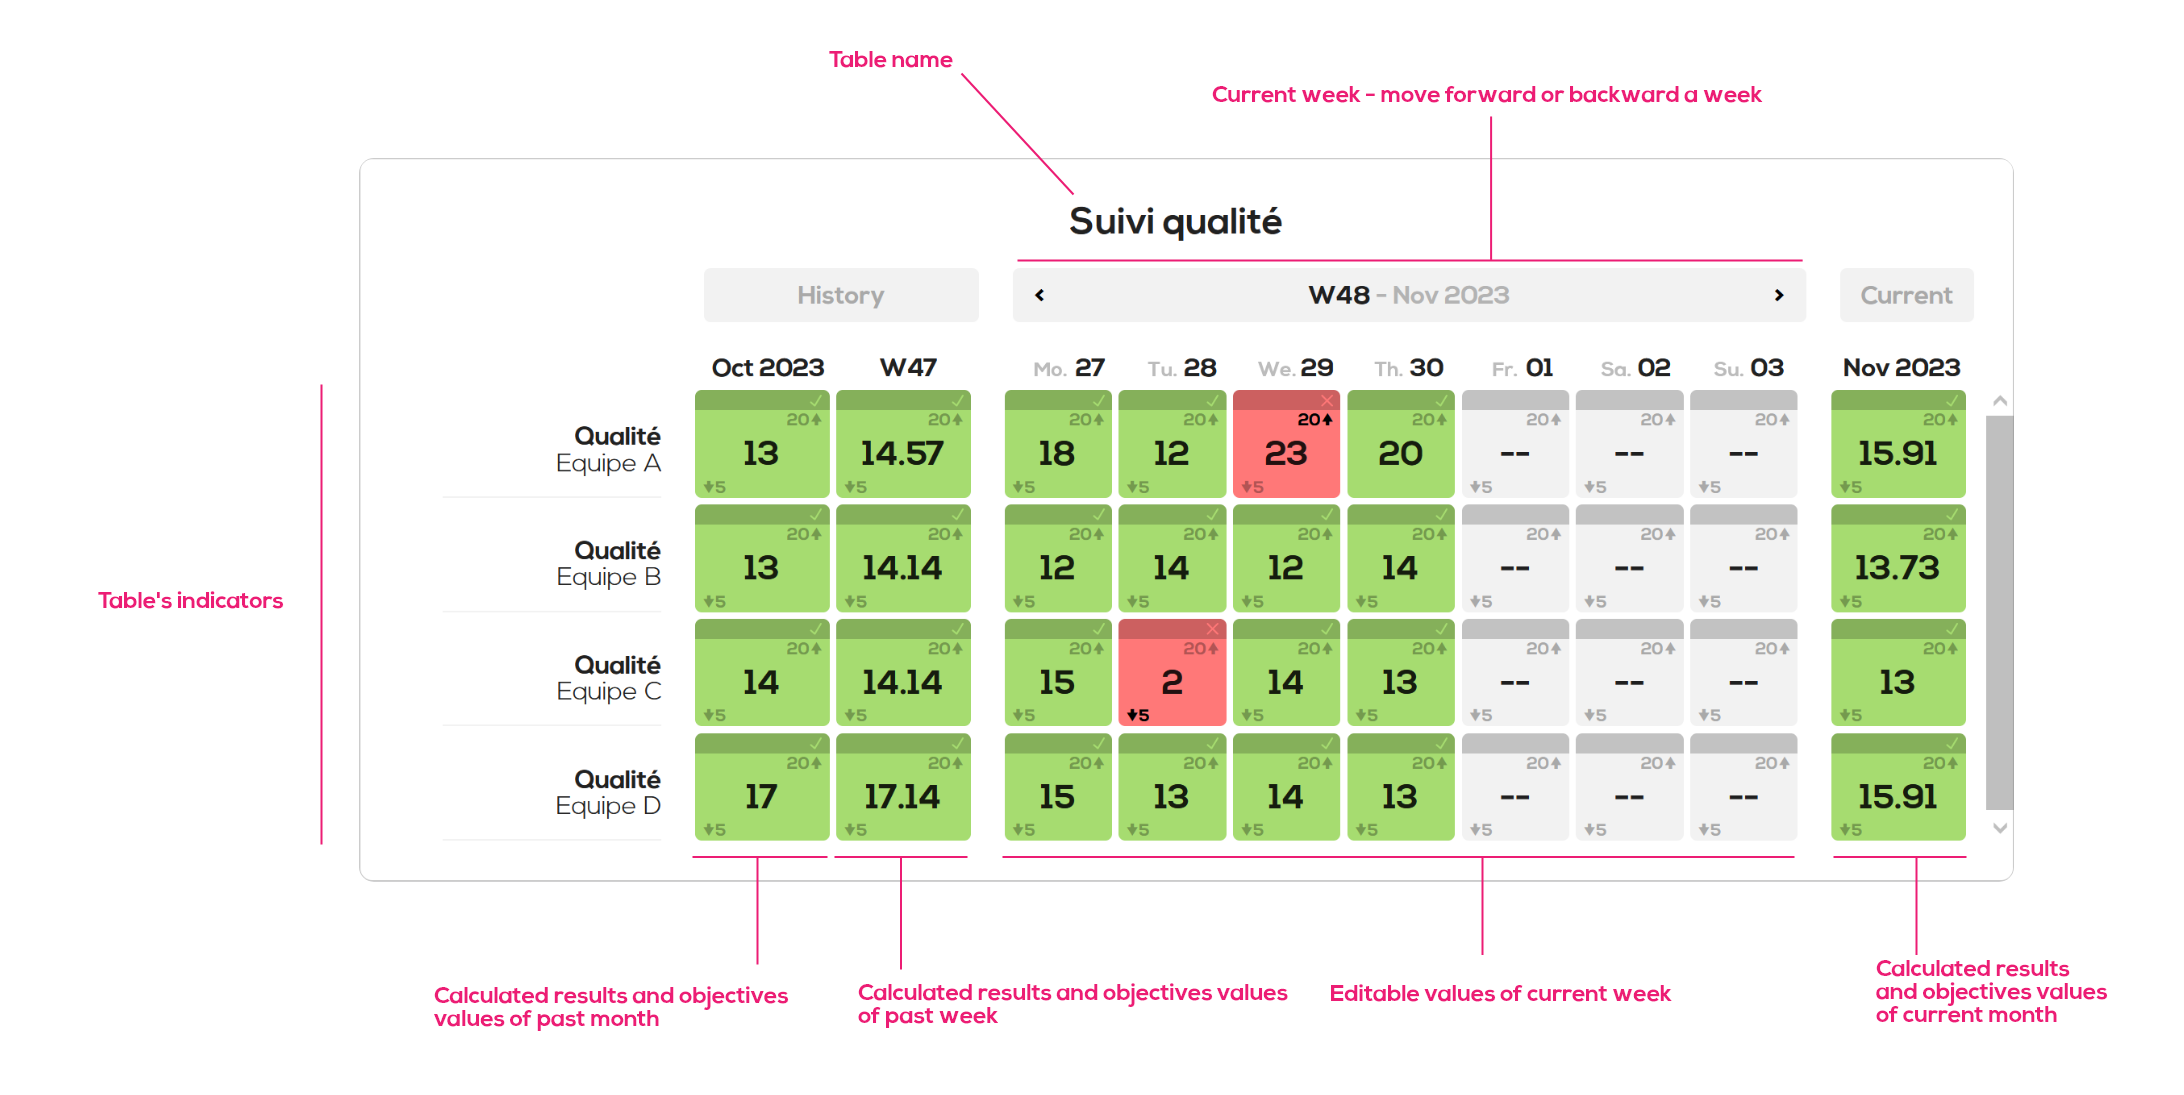
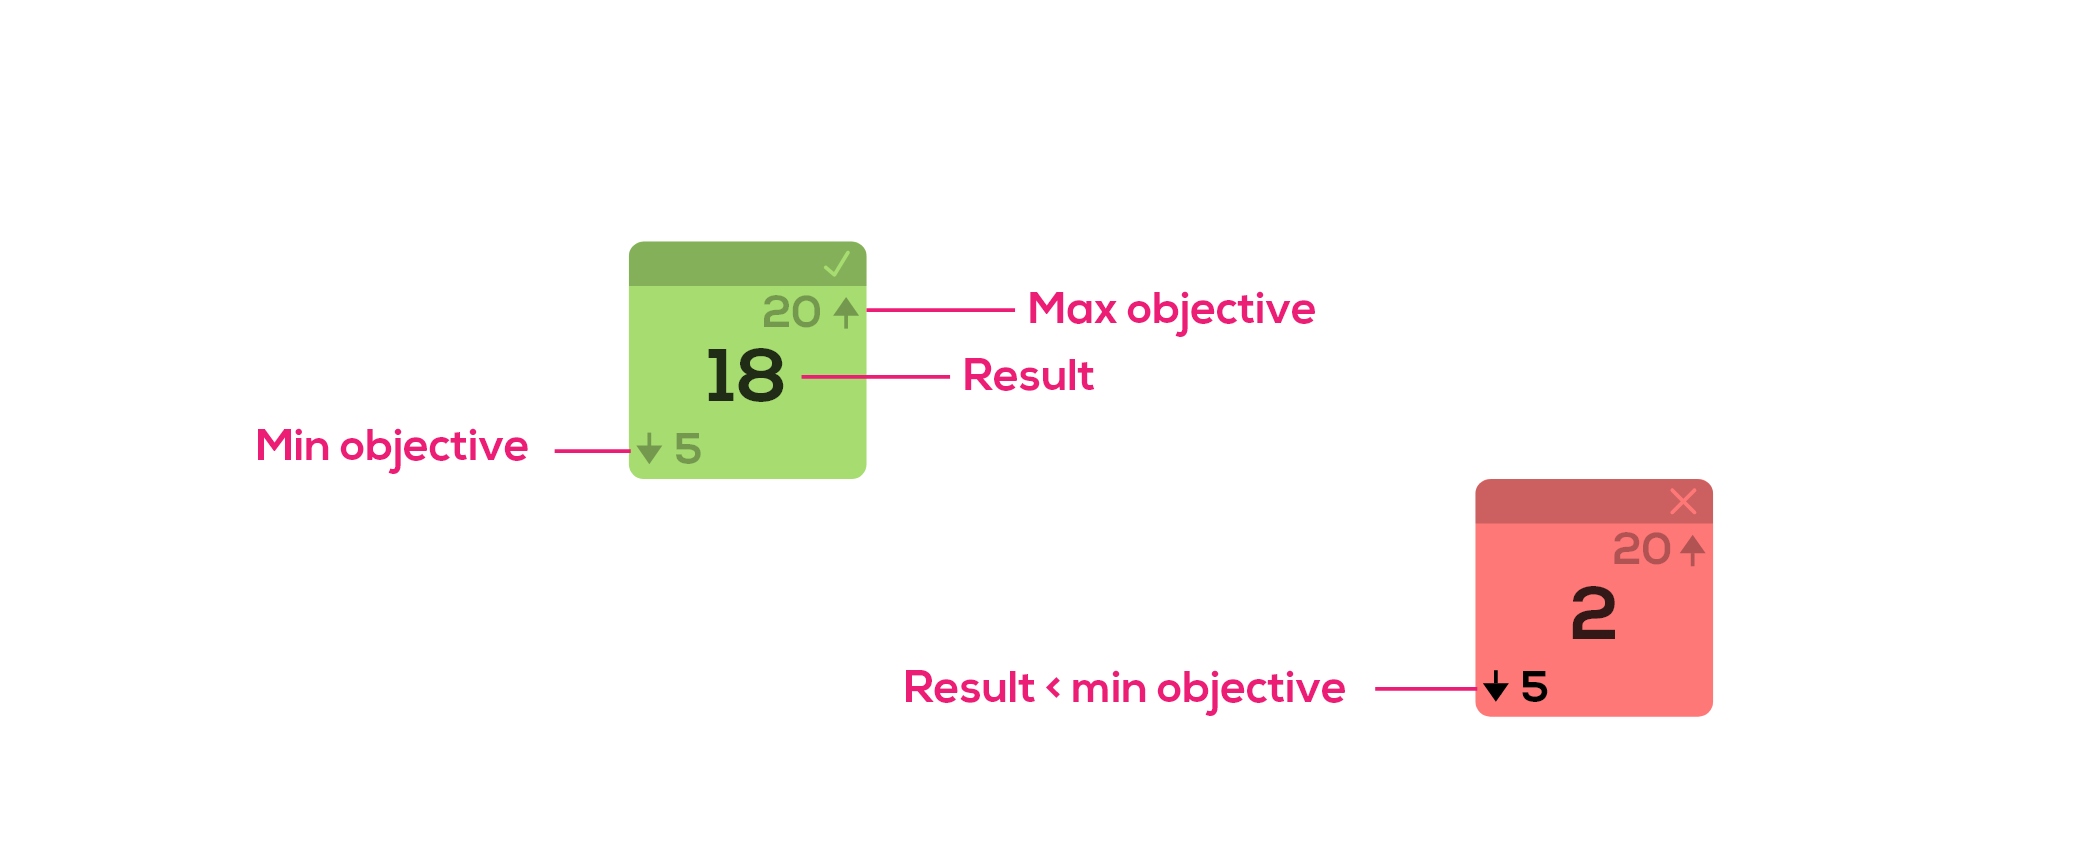
For a "classic" numeric indicator :
For a percentage numeric indicator :
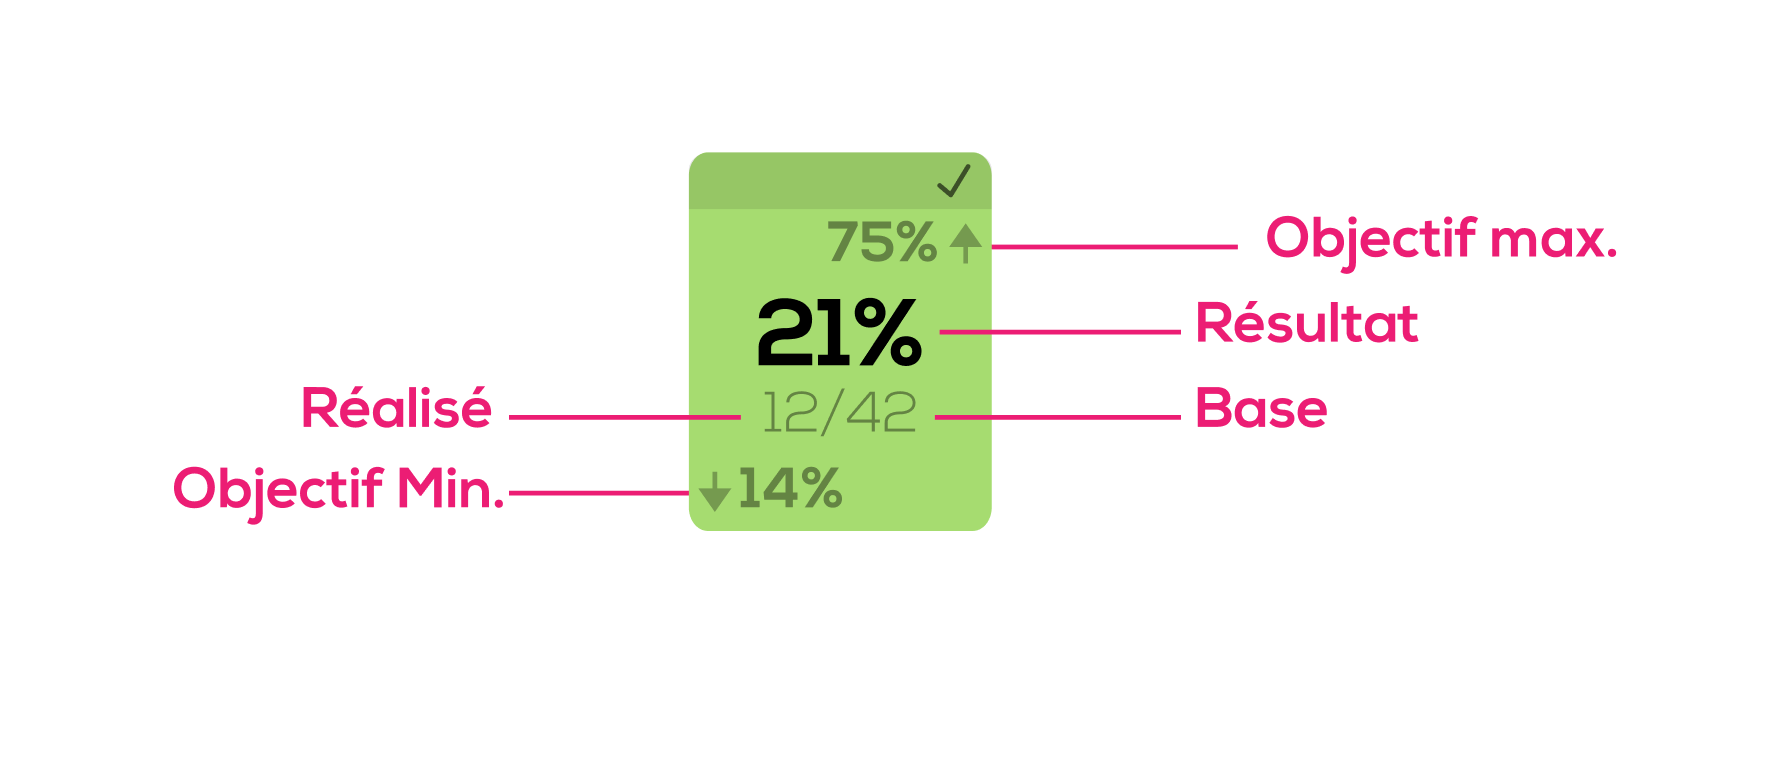
For a table cell to turn green, the result must be greater than or equal to the minimum target and less than or equal to the maximum target.
Note : you can use only the min objective, only the max objective or no objective at all. The empty objective values will be ignored.
Create a weekly table
In order to create a weekly table, right click on your document background and select "New indicator view" then "Weekly table".
The weekly table configuration window opens :
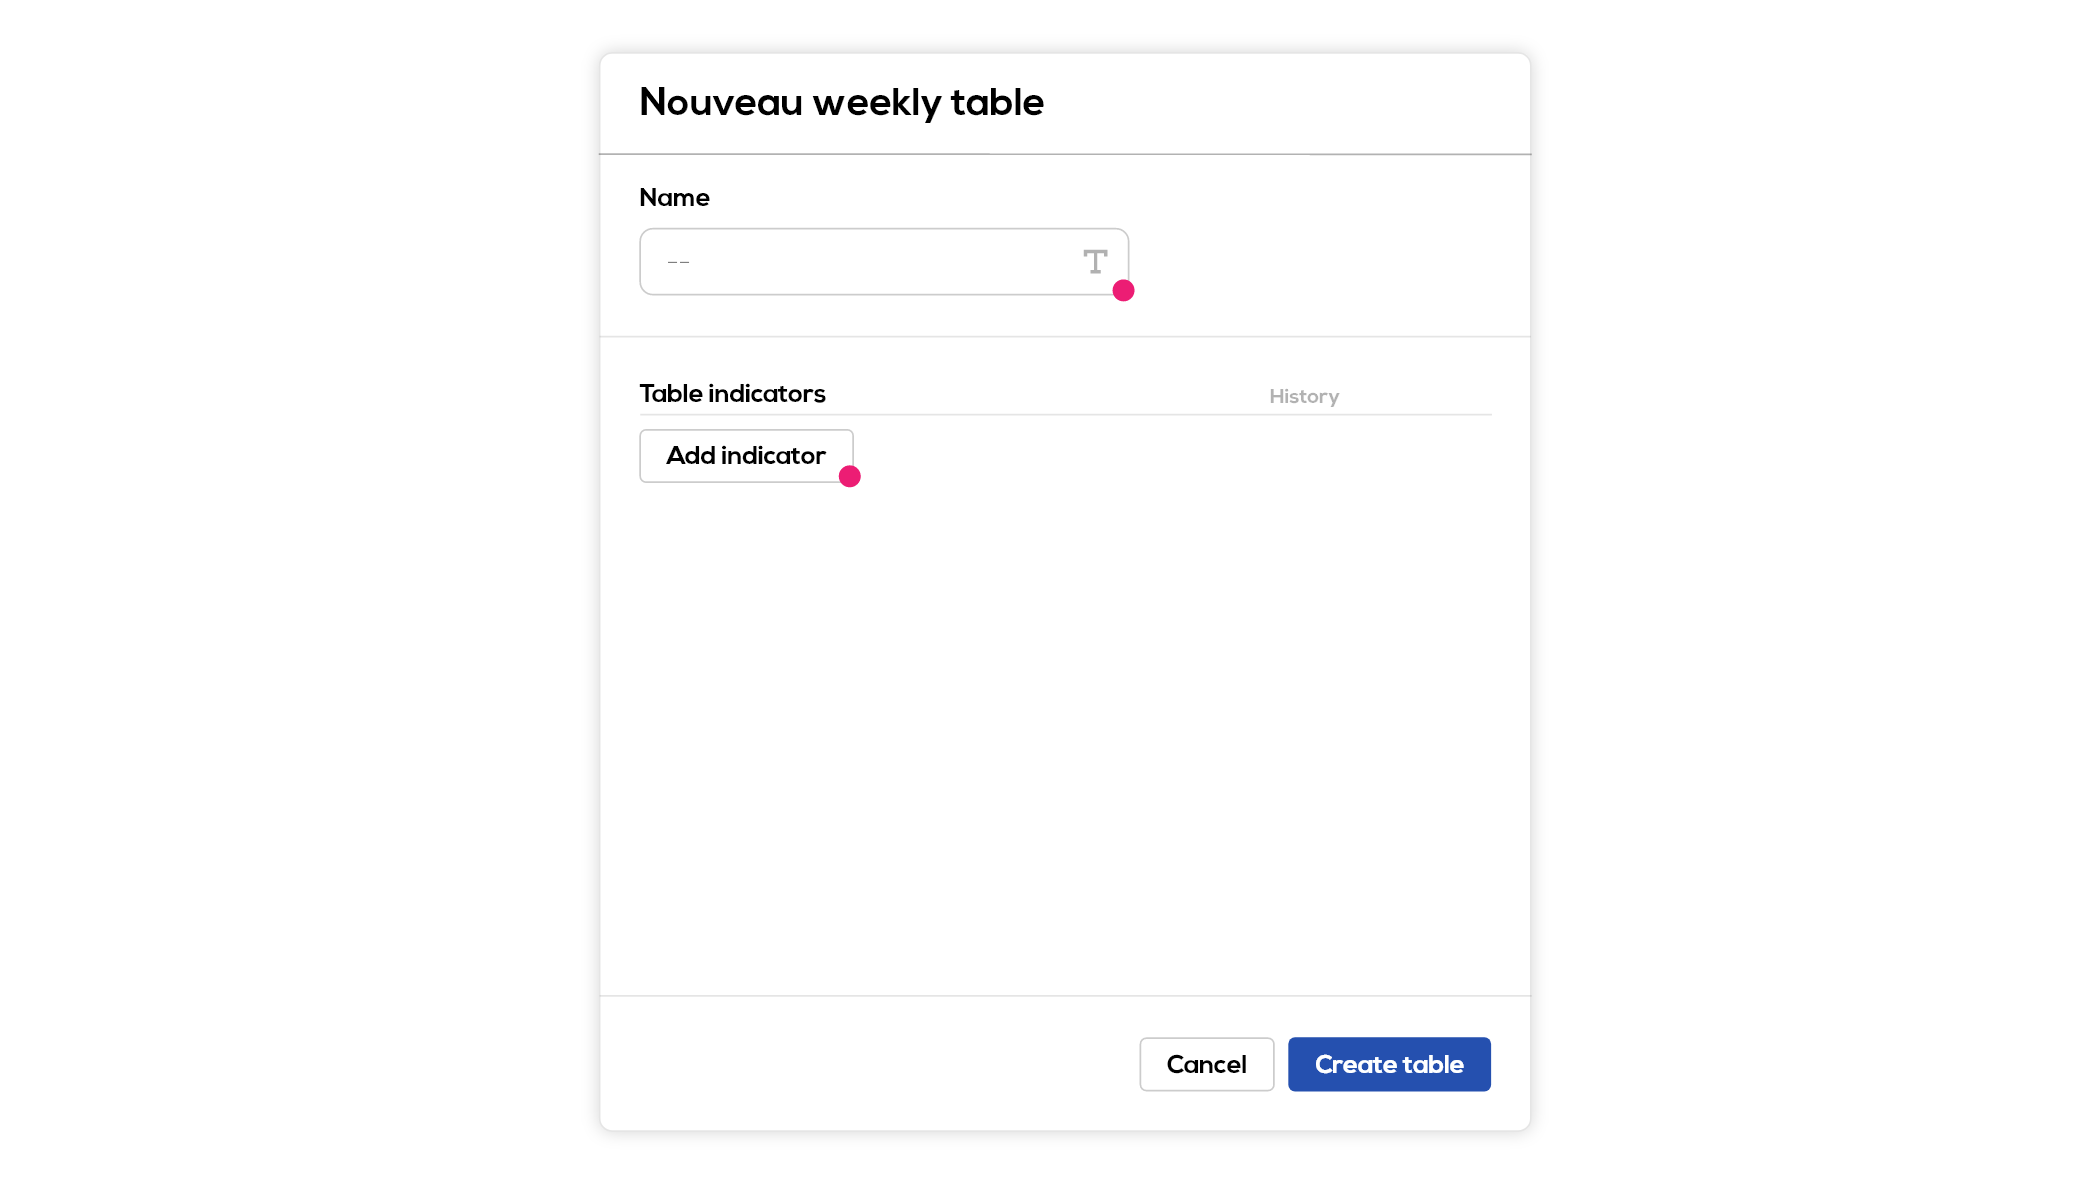
- Type in a name for you weekly table
- Click on "Add indicator" : the "add indicator" window opens.
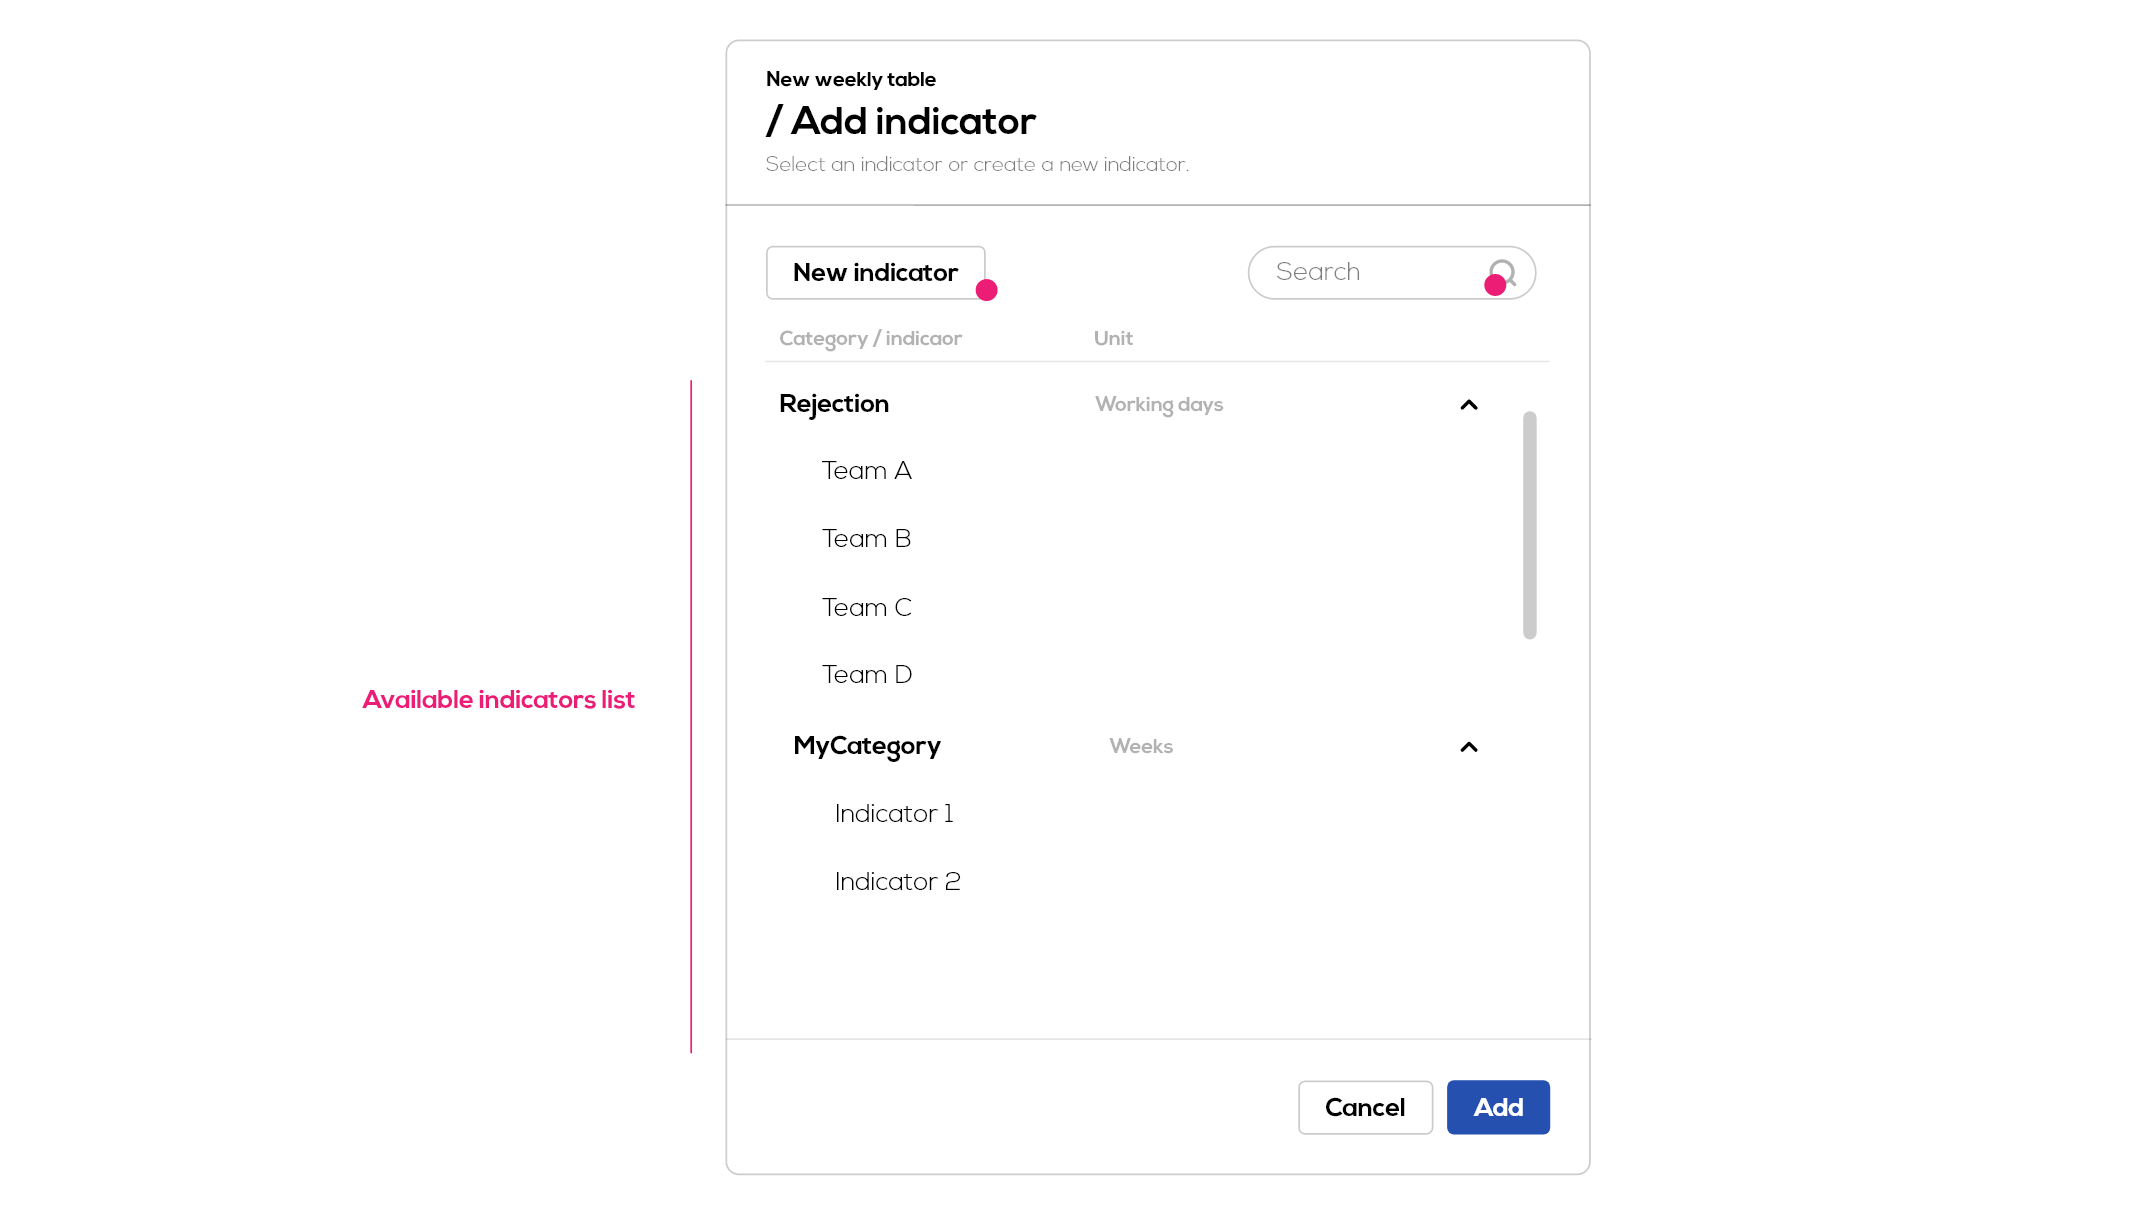
Select one or more indicators to add to your table from the available indicators list. Only daily indicators (days or working days) are compatible with the weekly table. You have access here to all indicators from your project and whose unit is days or working days. Note : You can add multiple indicators at a time.
Use the search field to filter the list by indicators or categories name.
You can also create a new indicator directly from this window by clicking on "New indicator". To know more about indicators.
Once you have selected the indicators you wish to add to your table, click on "Add". The selected indicators will be added to the list of indicators in the table.
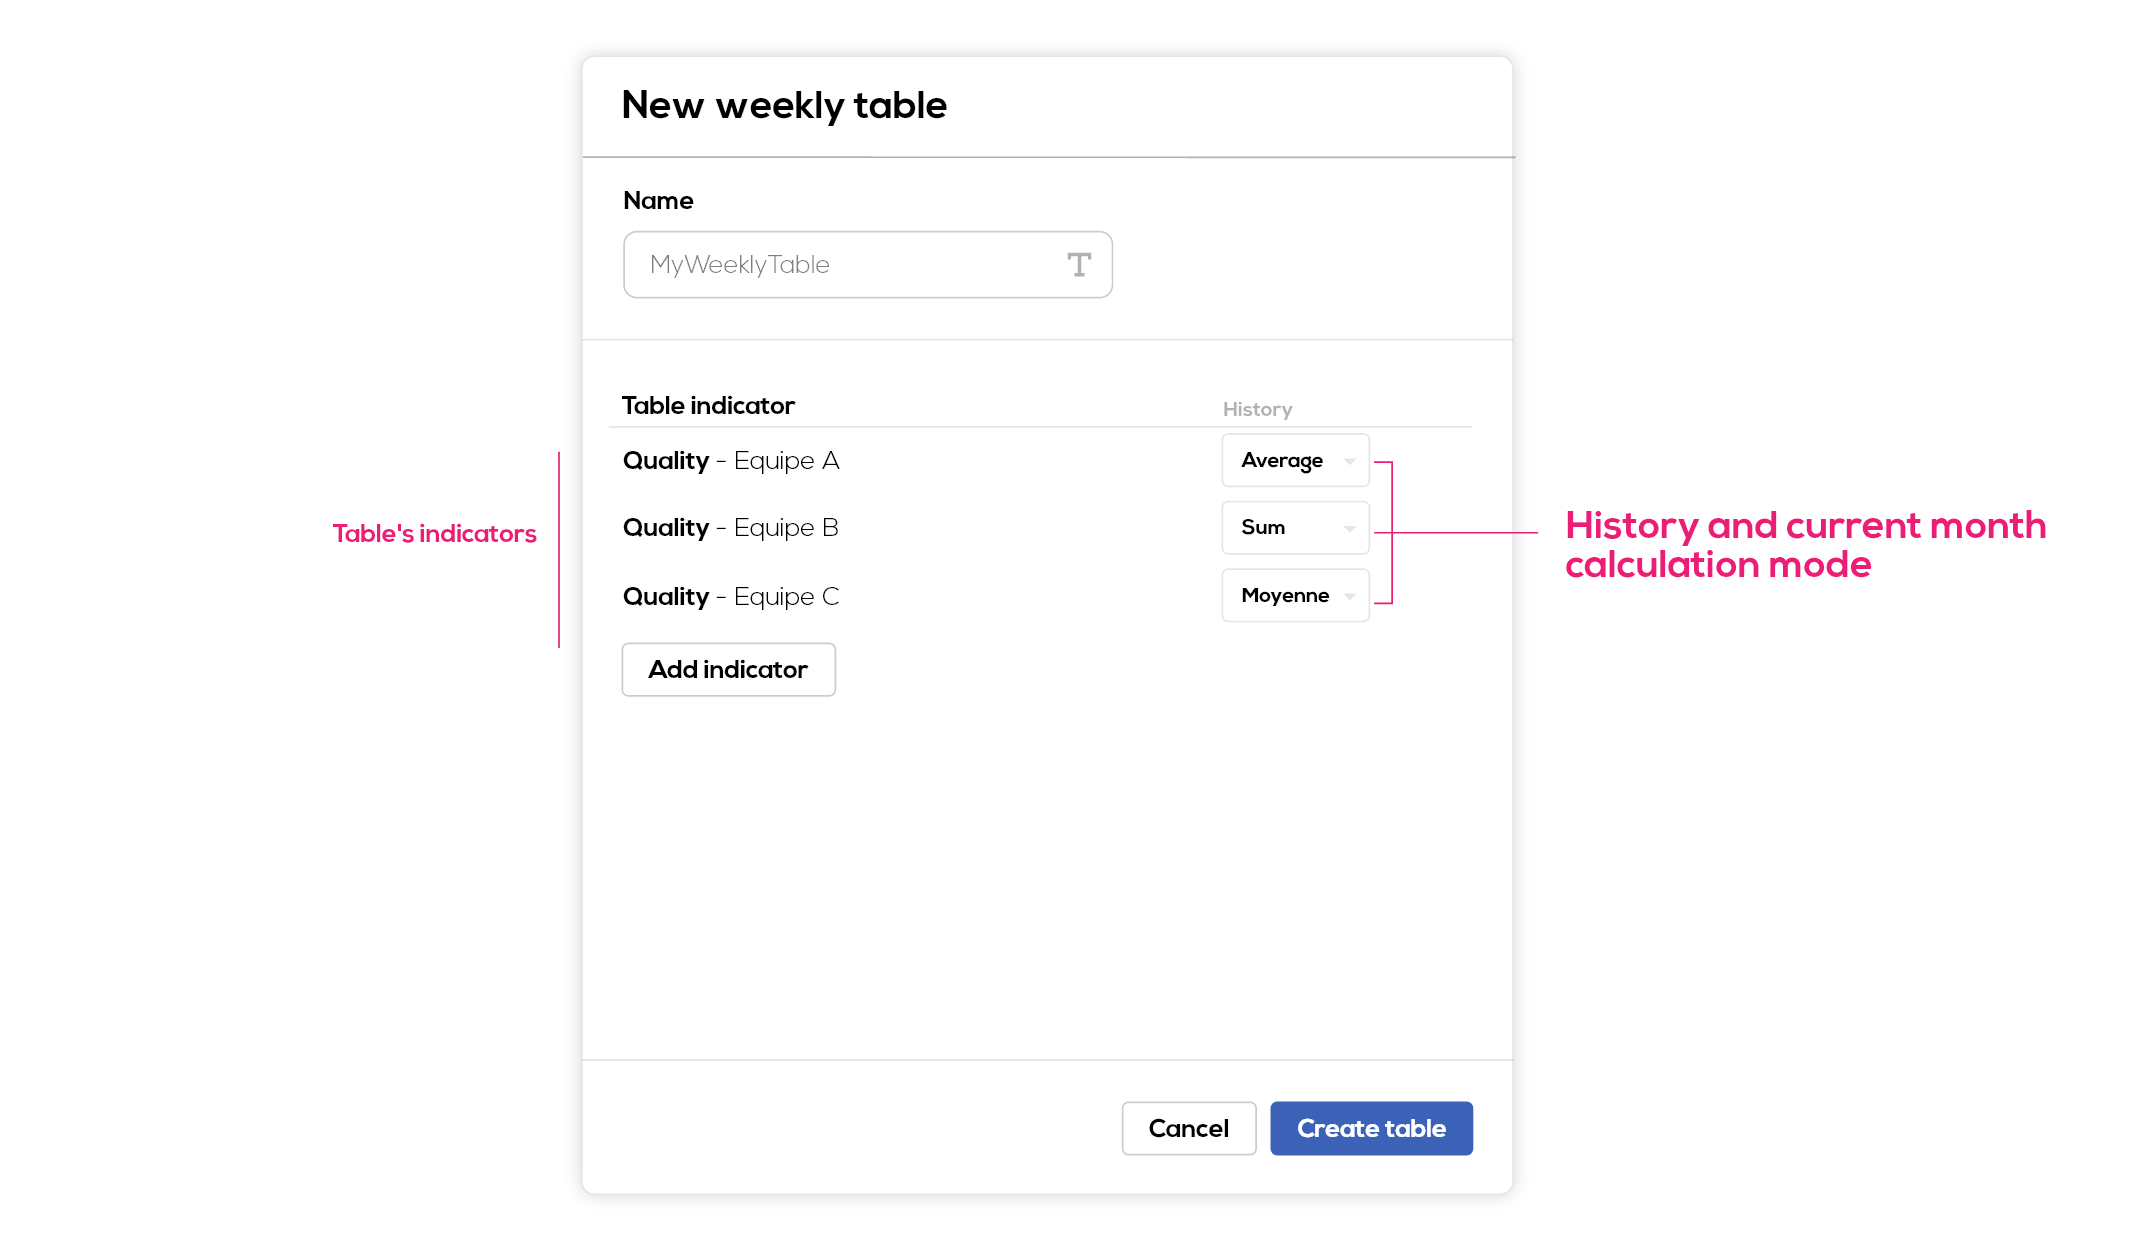
Calculation mode of history and current month : for each indicator, you can choose to calculate the history using a sum, average or weighted average (only for % indicators) function.
Note : the empty results values will be ignored. The objectives values without an associated result will be ignored as well.
For a sum : result value is the sum of the results over the period, objectives values are the sum of objectives values over the period.
For an average : result value is the average of results values over the period (my = sum(realized) / number of values), objectives values are the last objective filled over the period.
For a weighted average (% indicators) : moy. pond = sum (realized) / somme (base). Objectives values are the average of the objectives over the period.
Edit indicators in a weekly table
To edit an indicator value in the weekly table, click on the corresponding cell. Please note that only weekly values can be modified: historical and current month values are automatically calculated on the basis of values entered for the period.
The value edition window opens :
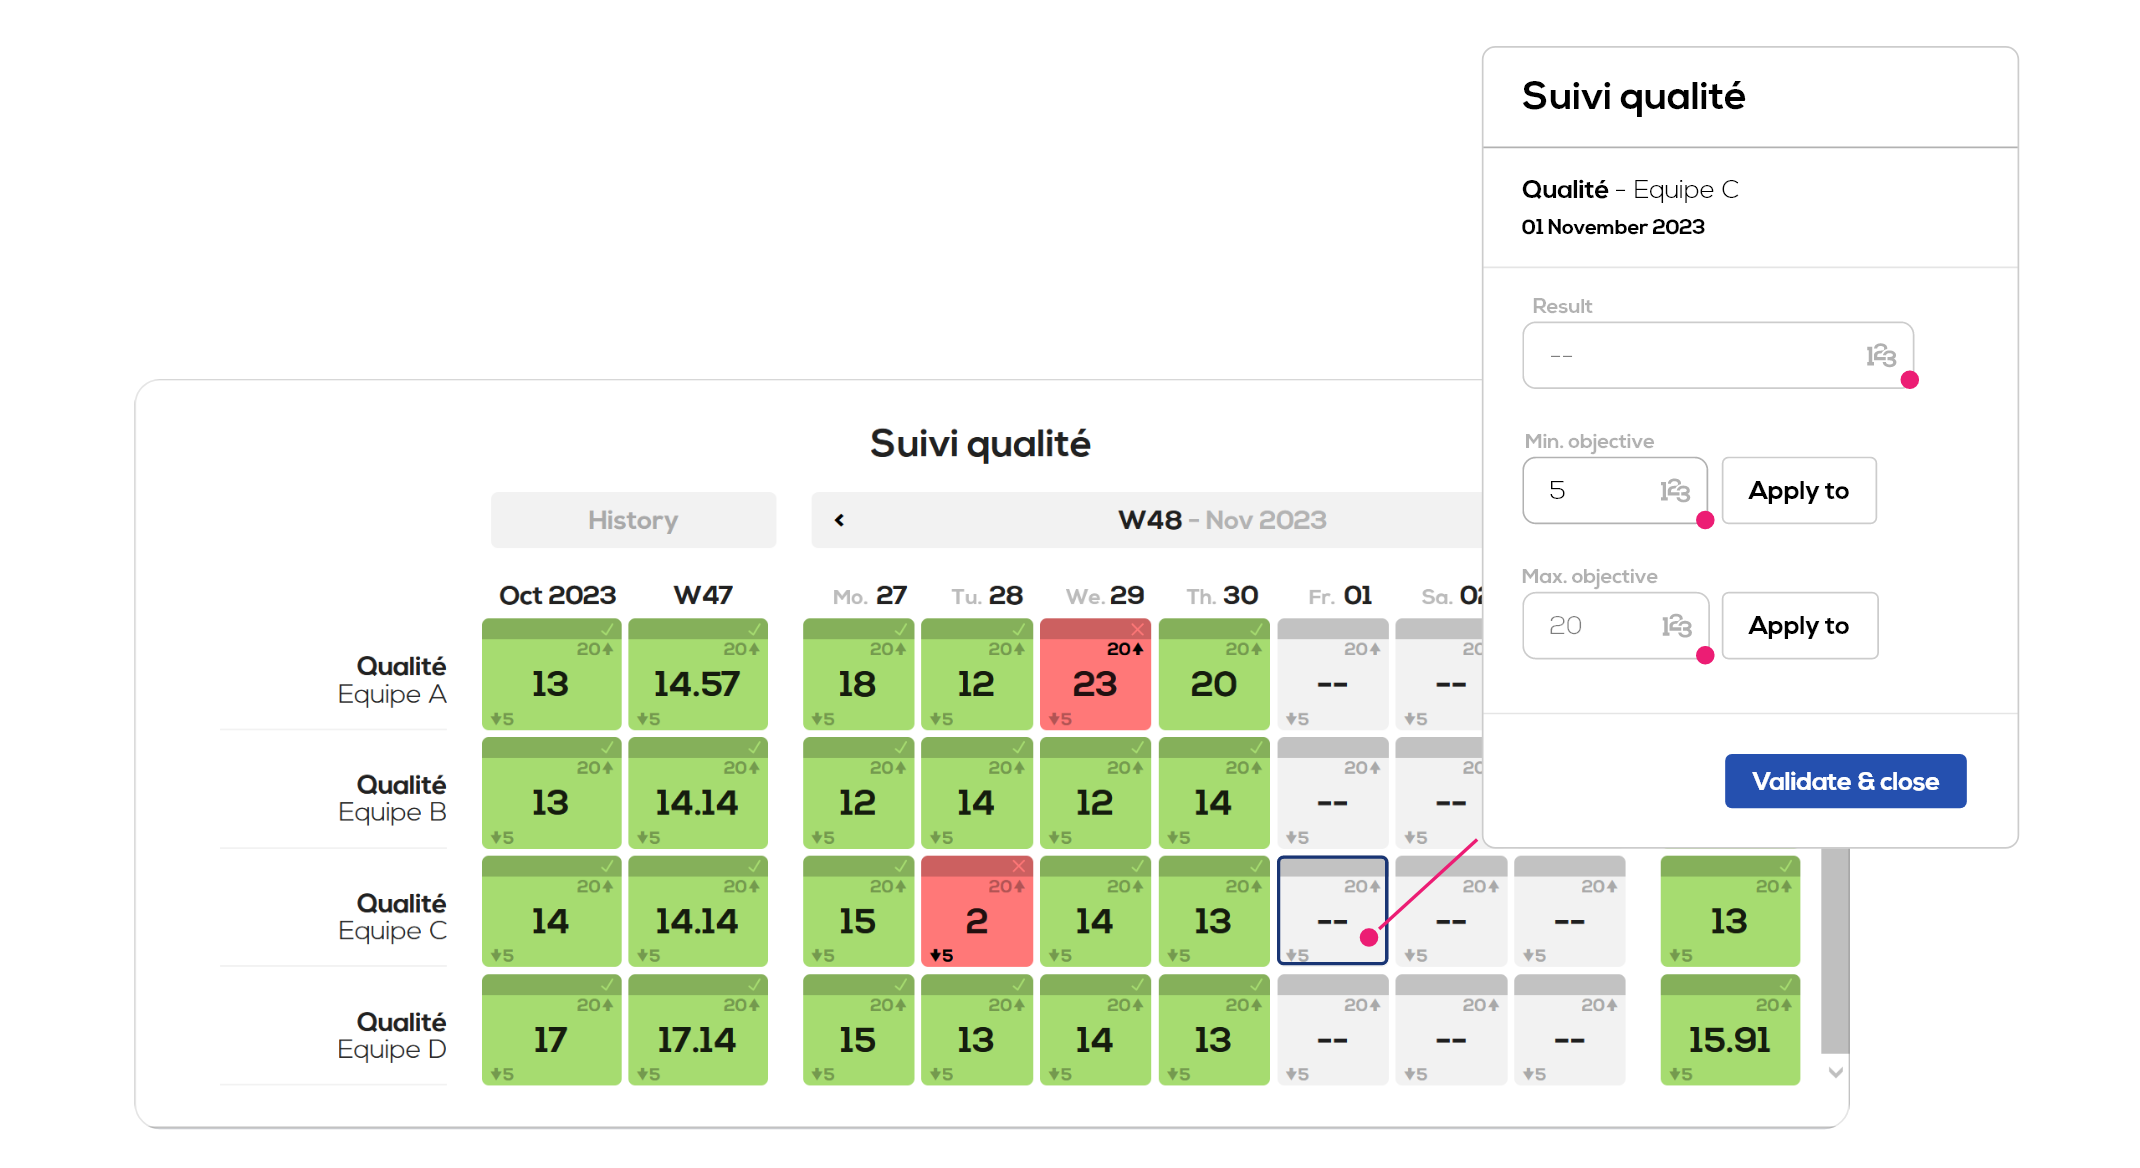
1 . Result value
2 . Min objective value
3. Max objective value
"Apply to" button enable you to apply the corresponding objective value to a period of time.
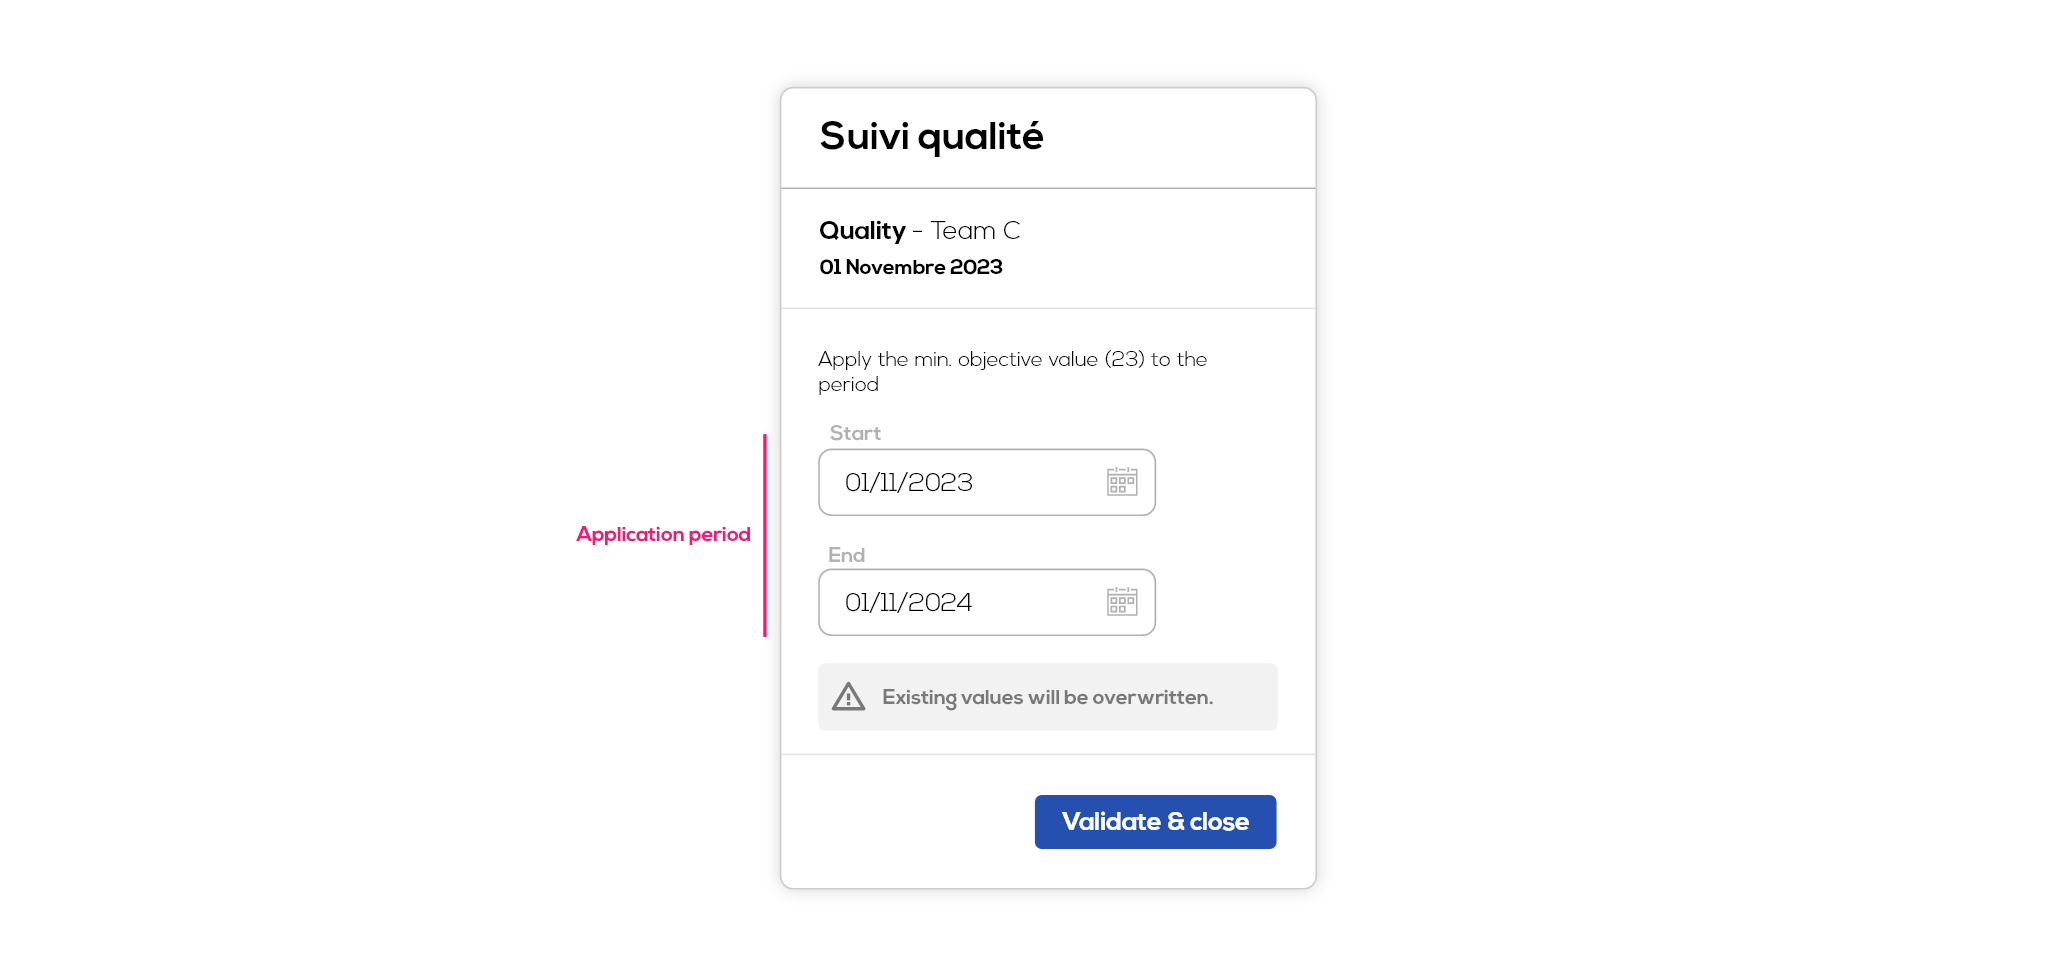
Note : fields are automatically filled with a one year period starting from the selected date.
Note : if objectives values are already filled within the selected period, they will be overwritten.
The others indicator views : monthly calendar, safety cross, chart.