- Indicators that you can create and use within your documents (empty, table, planning) of which this article is about.
- Indicators documents or Kpi document (see create and edit Kpi documents)
Indicators enable you to track a result through time and to automatically compare it with your objectives
An indicator is based on a type of data (numerical, color) and a unit (frequency).
Indicators types :
- Numerical : the result is a numerical value, supplemented by a min objective value and a max objective value. If the result is lower than the max objective and upper than the min objective then is objective is validated and the corresponding square turns green. The two objective values are optional, you can choose to use one, the other, both or none at your convenience.
- Numerical % : the result is a value expressed as a percentage value, it is calculated as the "realized" value divided by the "base" value time 100. The result is supplemented by a min objective value and a max objective value. An additional calculation mode is available to consolidate percentage indicators : weighted average. For more details, see : "Percentage indicators"
- Colors : the result is chosen from a list of two or three options that can be configured from the indicator category. Each result is made up of a color, a label and an icon.
Available frequencies :
- Days
- Working days : from Monday to Friday
- Weeks
- Months
Perimeter :
An indicator is defined at a project level : meaning it is available and editable as much as you want within its project. It is also possible to use the indicator data from another of your projects with a consolidated indicator (see Consolidated indicators).
Indicator view :
An indicator needs to be associated with an indicator view (visual representation of data from one or more indicators) placed in a document. These views enable you to display and edit indicators data.
For example here : the weekly table view enables you to track the results value of an indicator, while having an overview of the history on the left and the current month on the right (see : Indicators table).

Availables views :
Create an indicator
There is two way for creating a new indicator : from the "Indicators" section of your project or document "Settings" tab, or directly while creating or editing a new view (weekly table).
Go to the "Settings" tab, then in the "Indicators" section and click on the "Edit" button.
Note : You can access indicators either from your document or from your project home page.

The indicators management window appears:
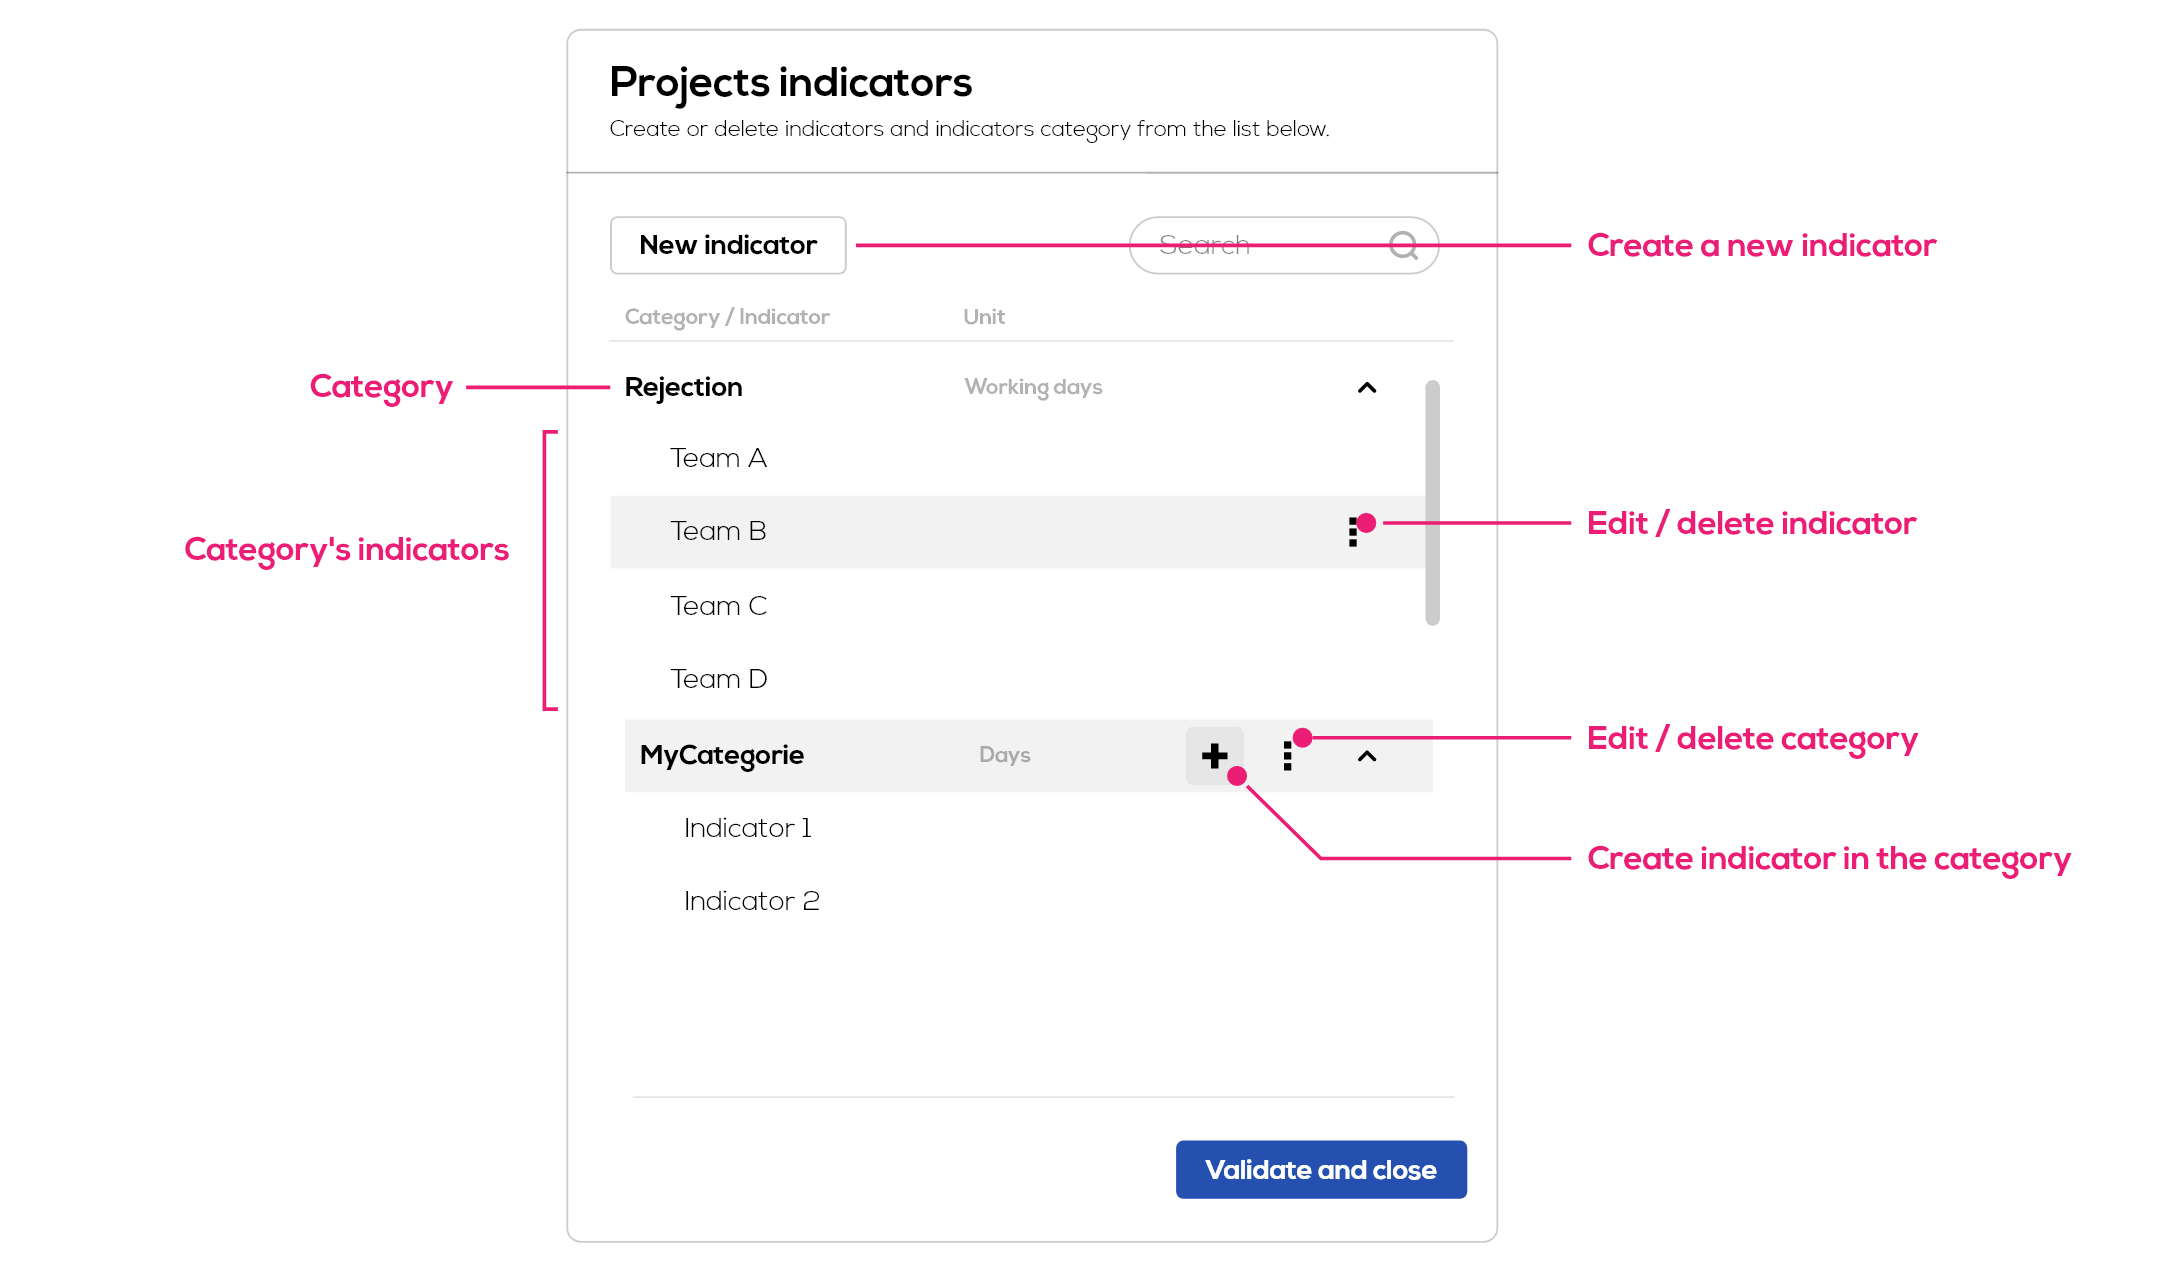
The category concept :
To facilitate the classification of indicators, you will need to categorize each indicator. Beware that the category define the unit of the indicator, so a "Team A" indicator classified in a "Rejection" category with a unit of working days will also have working days as time unit and will be placed under the "Rejection" category in the list.
Then click on "New indicator":
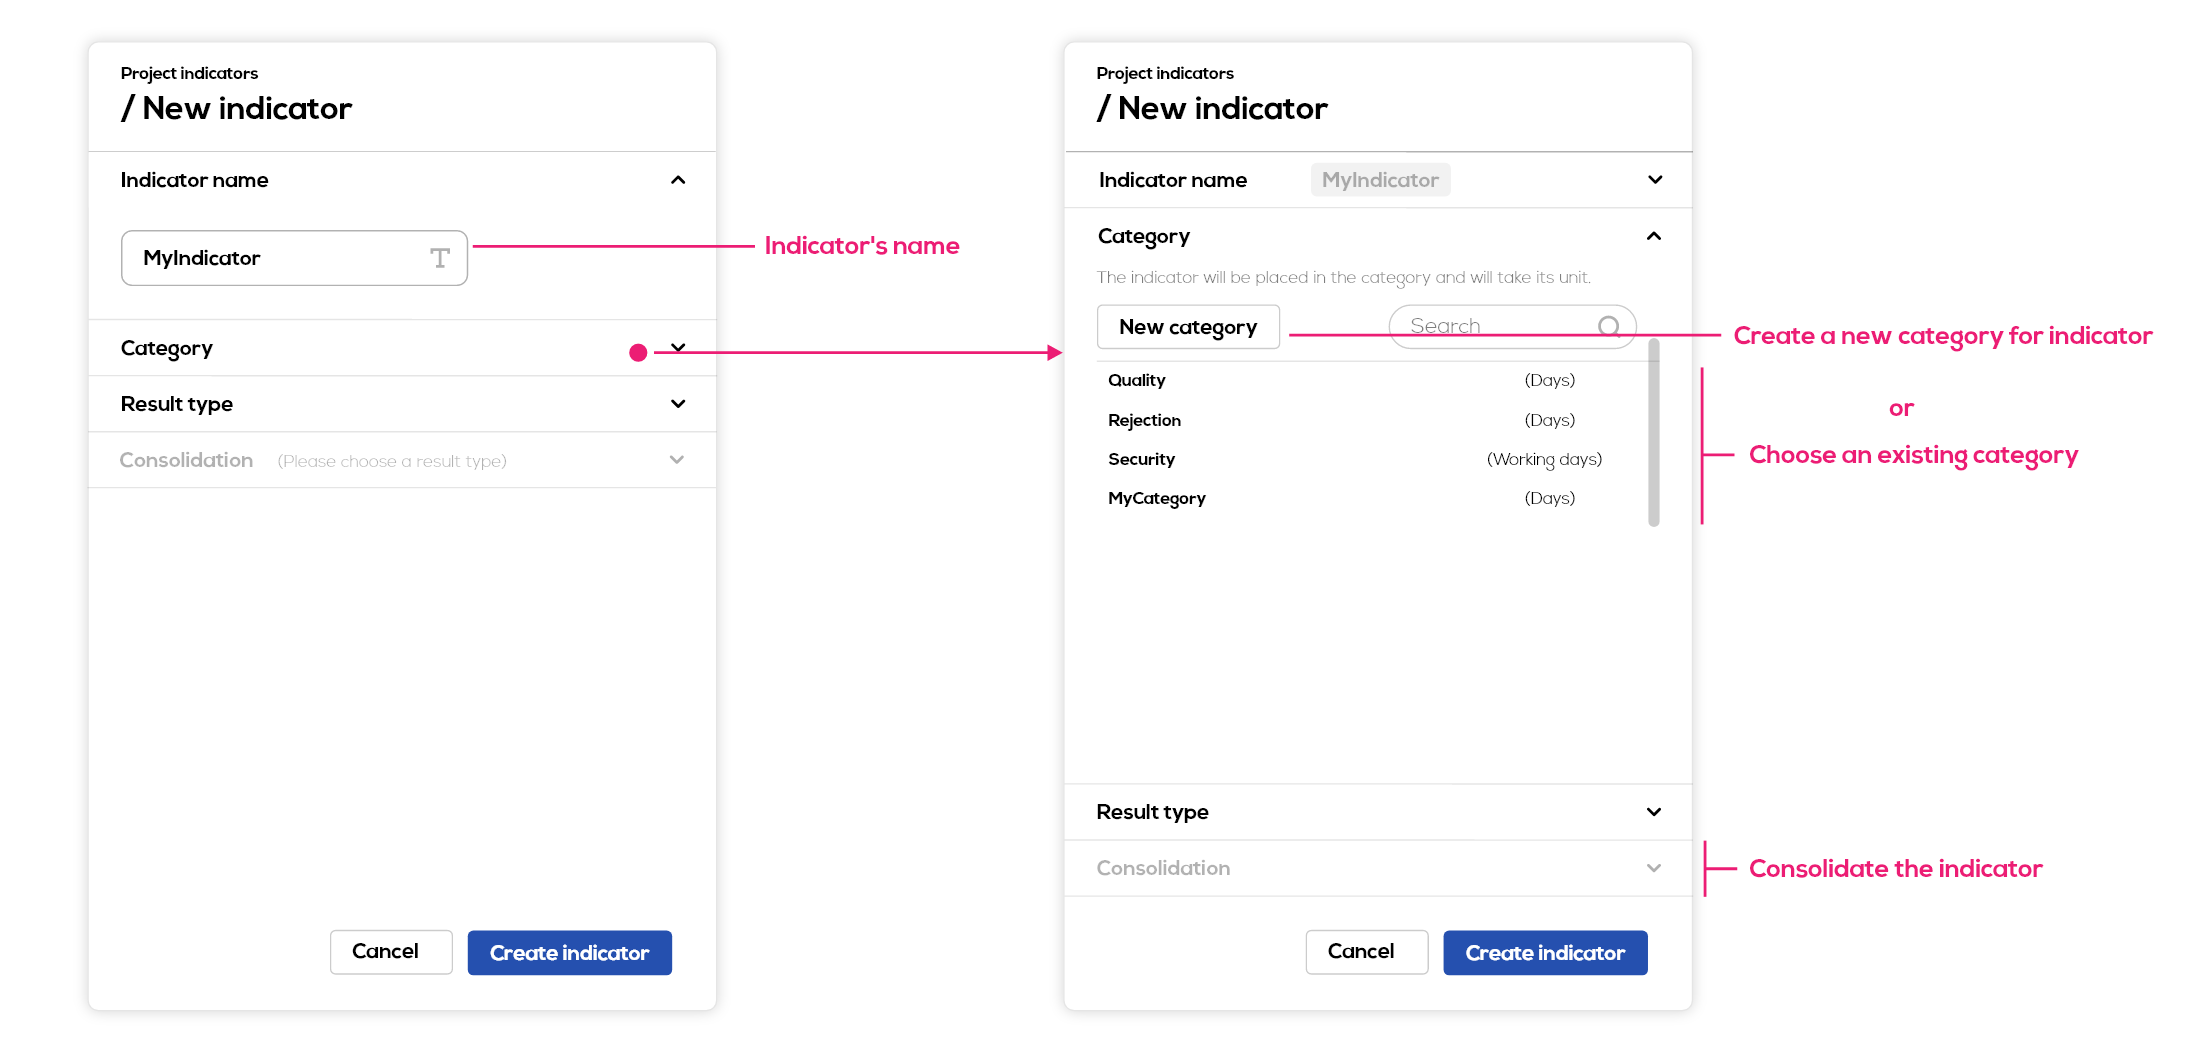
- First, choose a name for your indicator.
- Then click on category to go to the next step : choose an existing category or create a new category for your indicator. Beware that the indicator will take the time unit of the chosen category.
- The next step will enable you to consolidate the indicator : to know more about consolidated indicators (see : consolidated indicators). To create a indicator to be filled in manually, ignore this step.
Click on "Create indicator".
Create a category
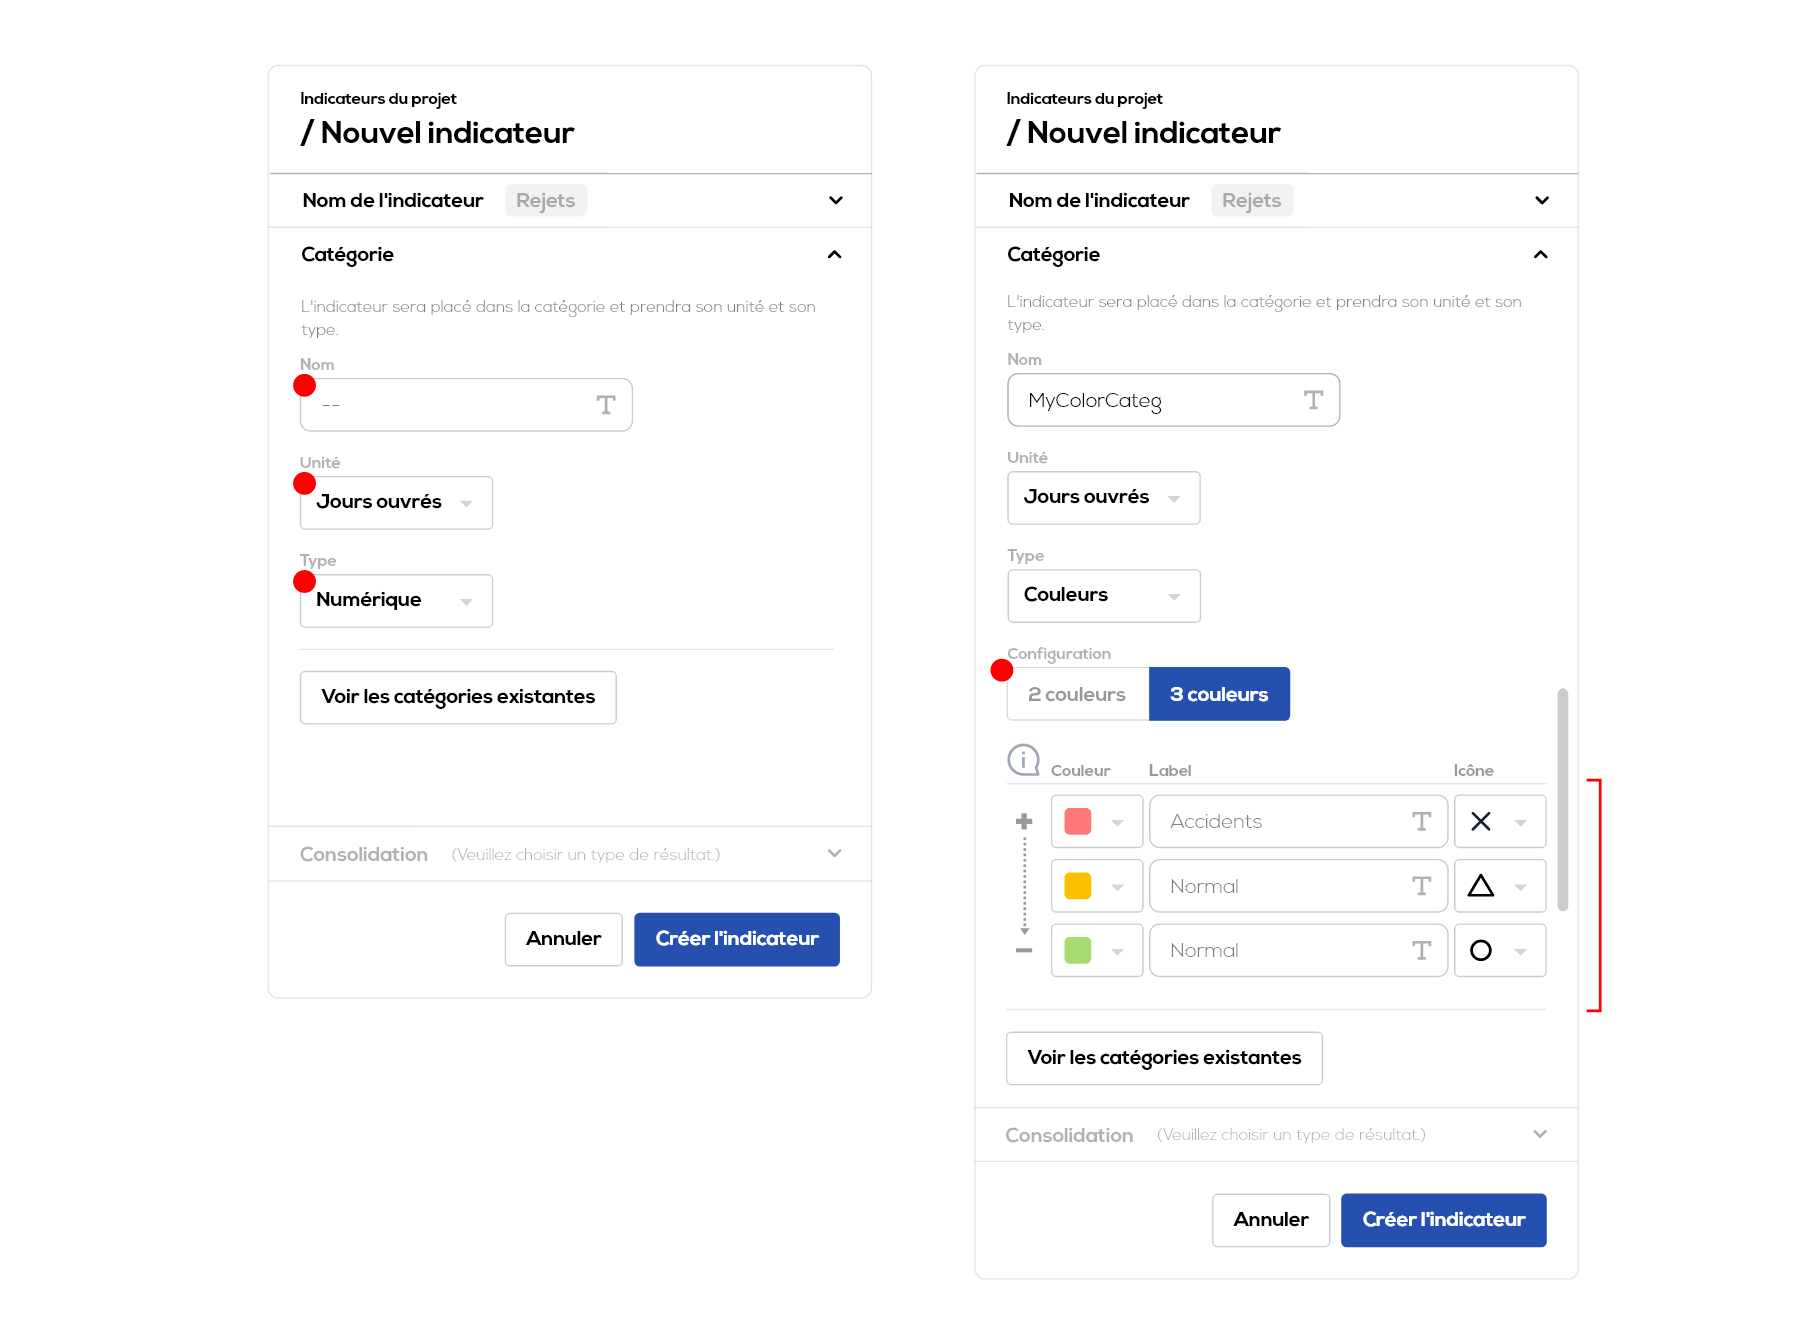
- Choose a name for your category.
- Choose a unit for the category (and its indicators), you can choose between days, working days, weeks and months.
- Choose the category type (type will also apply to its indicators), you can choose between color and numerical.
- Only if you select the color type : set up a list of result (color, label an icon). beware that the list order determine the criticality order of the results in case of a consolidation (see consolidated indicators). The most critical result (top of the list) will be dominant compared to other results.
You can also create an indicator from the creation window of a weekly table (New weekly table / add indicator) by clicking on "New indicator".
The interface is similar to the one presented above.
Note : When the indicator is created, it will be automatically selected so you can directly add it to your indicator view.
To learn more about Indicators table, Safety cross, Monthly calendar, Chart.