Indicators views
An indicator view is a visual representation of one or more indicators within a document (see indicators). The availables views are : indicators table, safety cross, monthly calendar and chart.
Indicators table
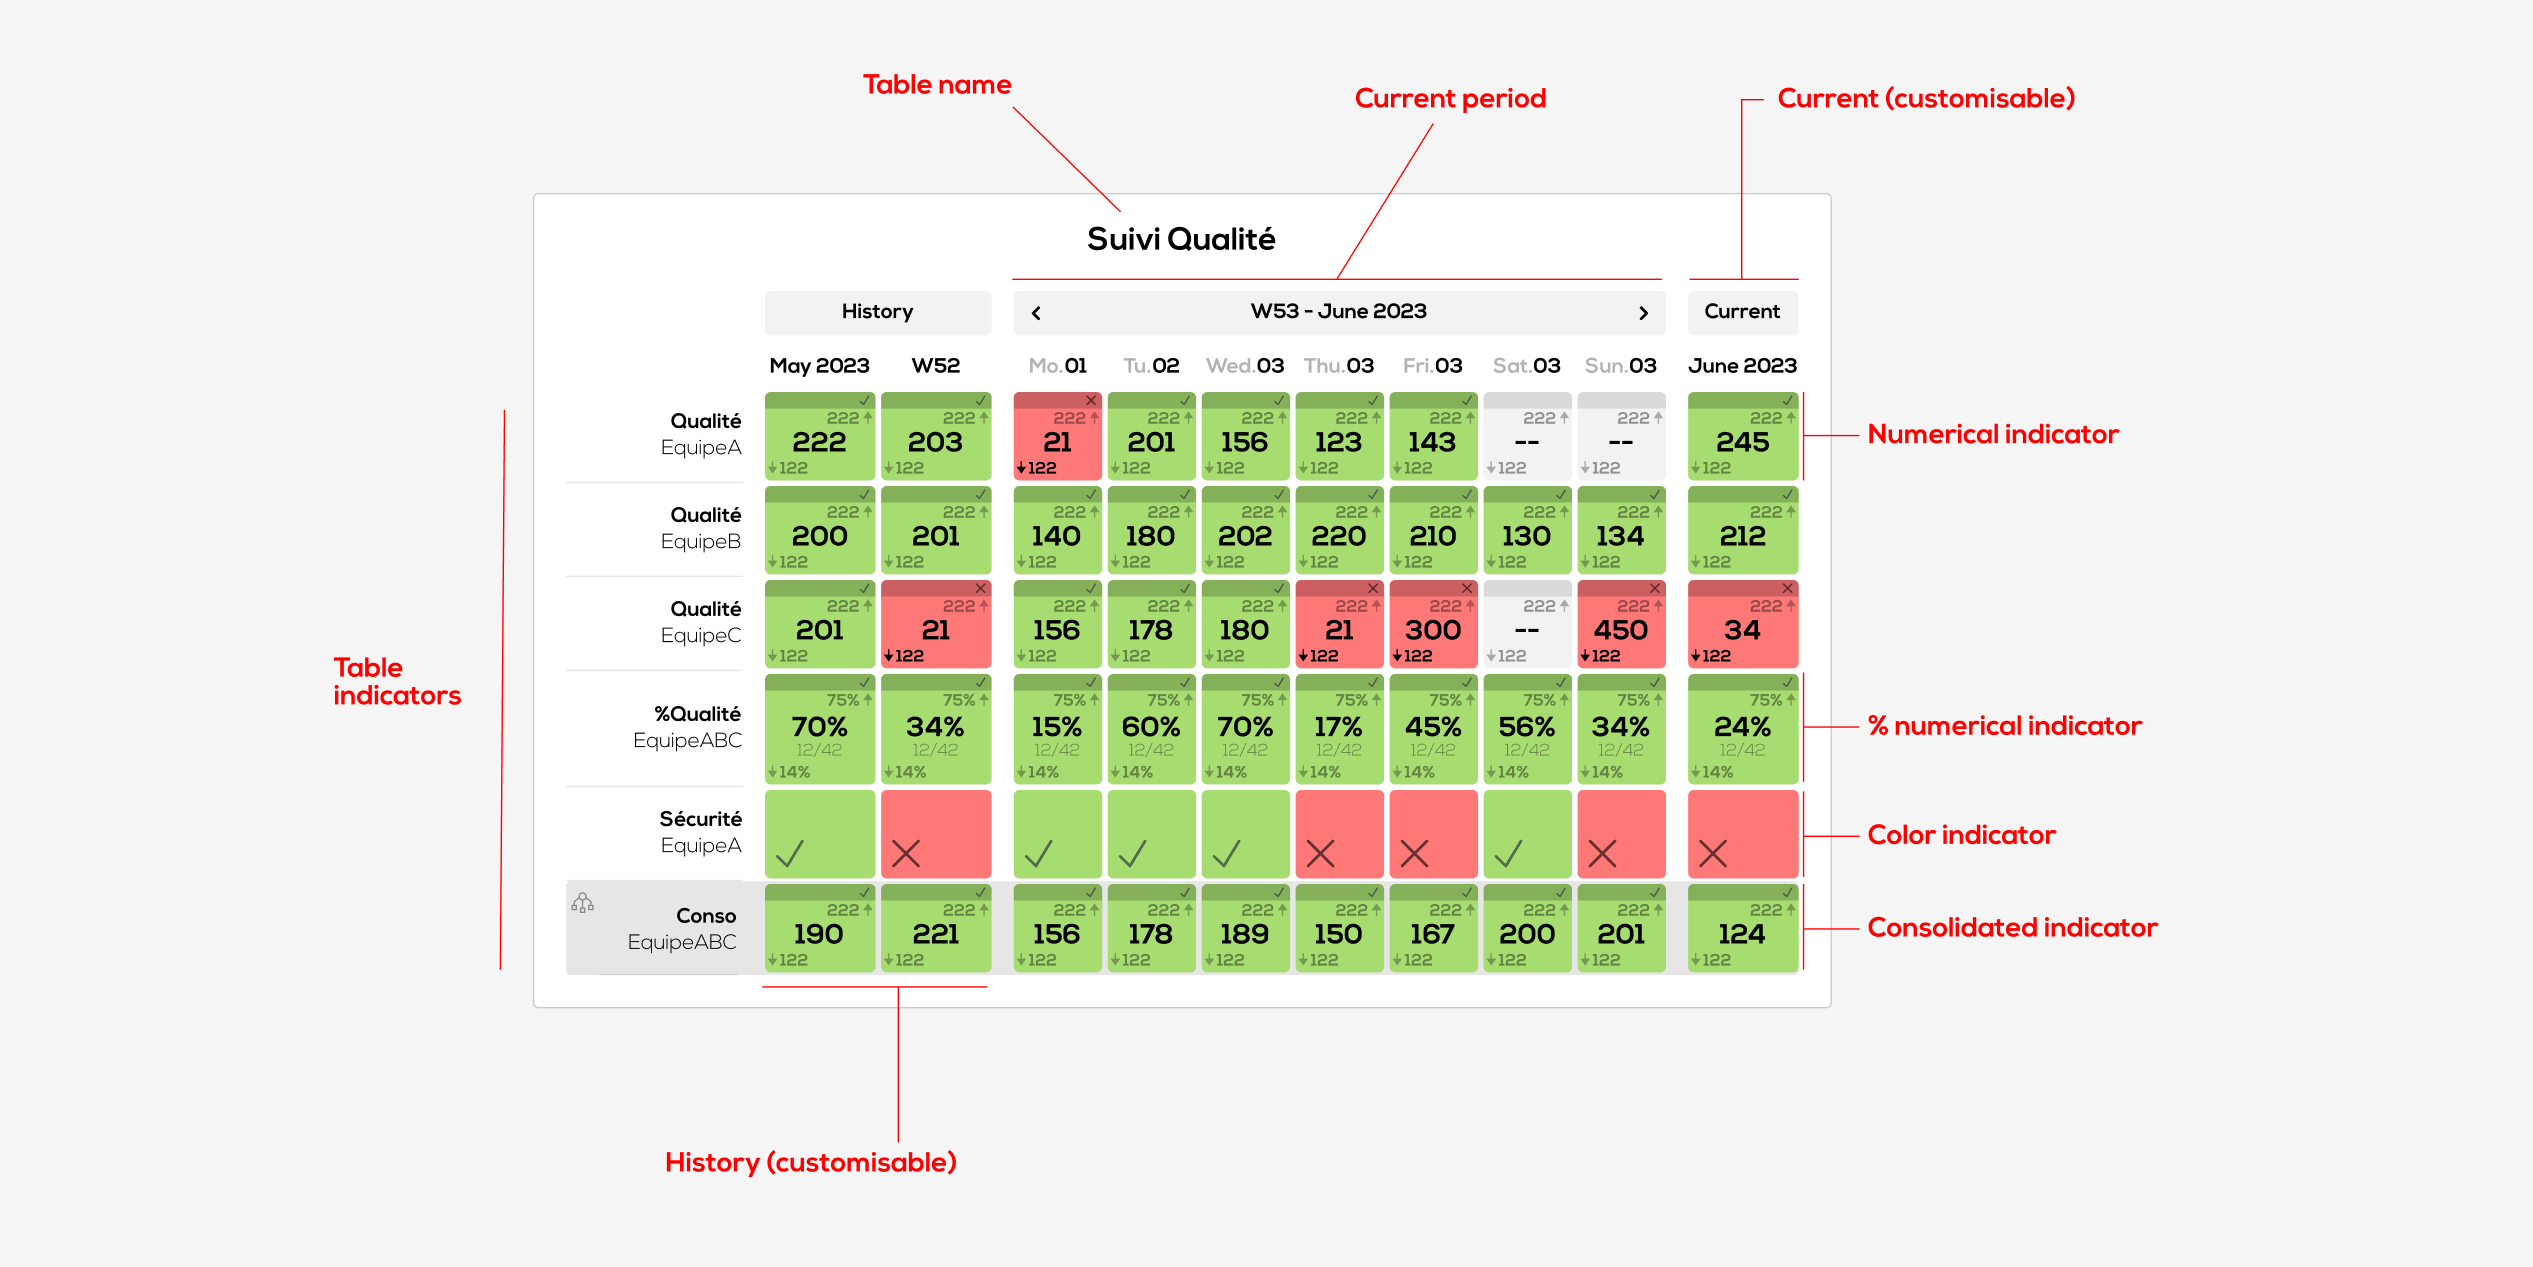
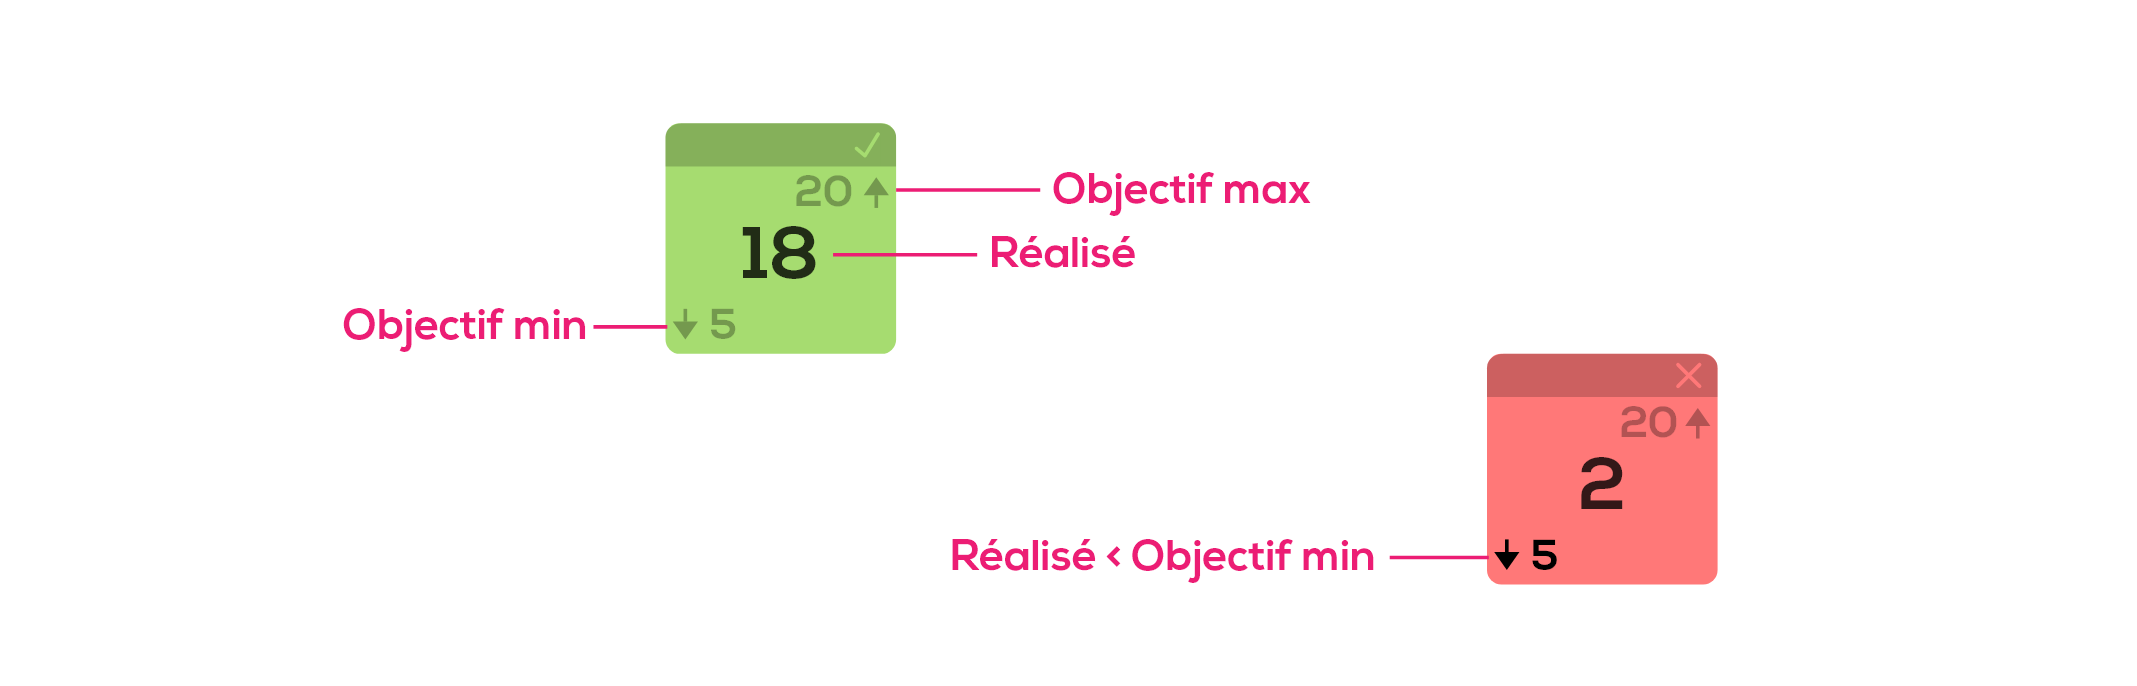
For a classic numeric indicator :
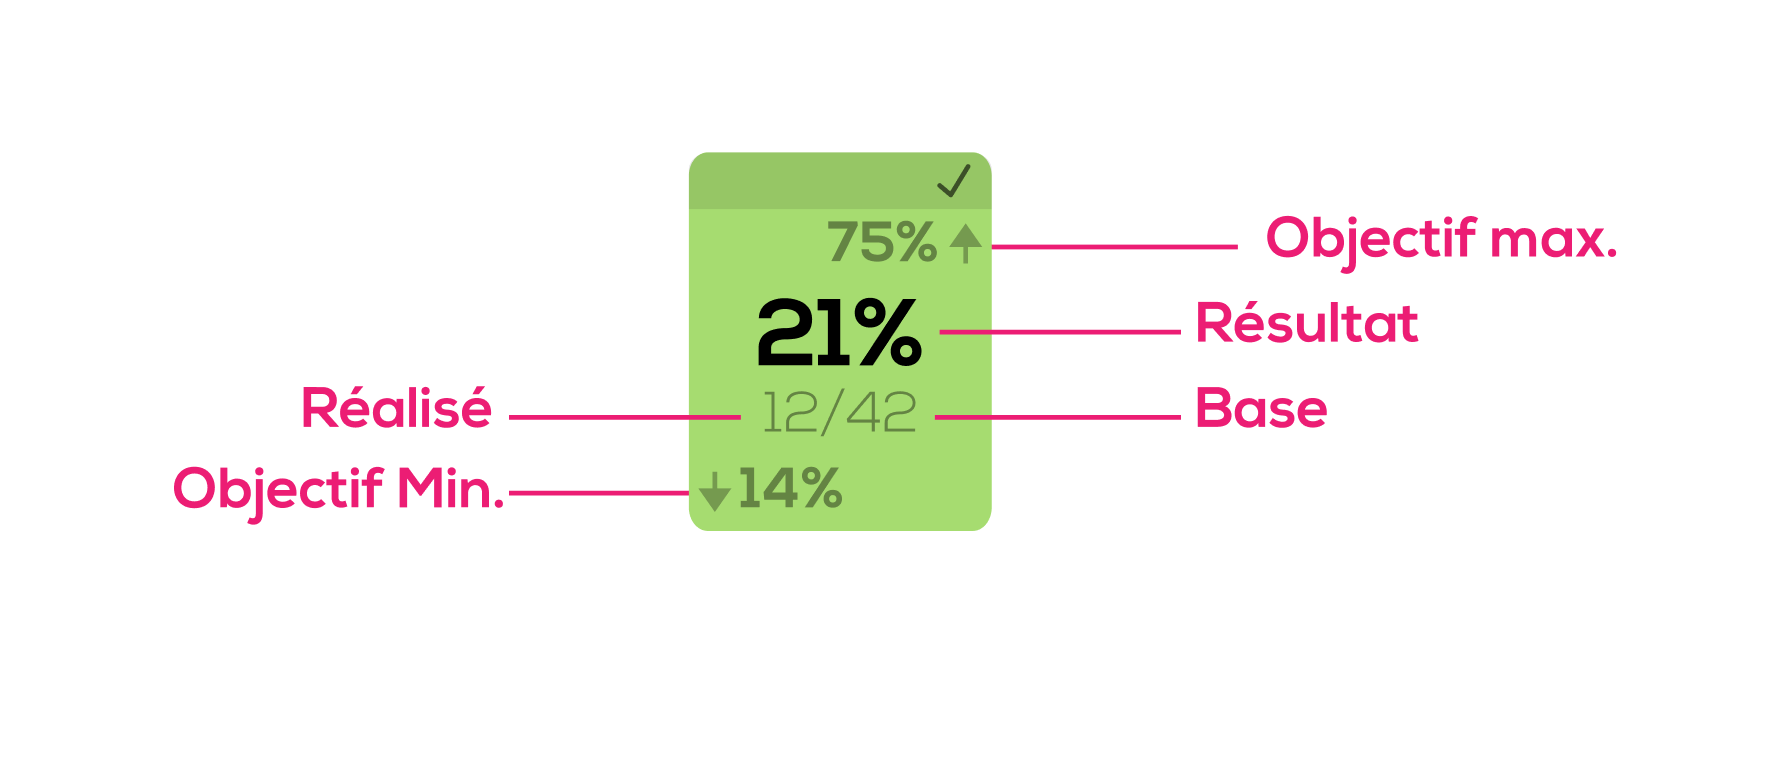
For a percentage numeric indicator :
For a table cell to turn green, the result must be greater than or equal to the minimum target and less than or equal to the maximum target.
Note : you can use only the min objective, only the max objective or no objective at all. The empty objective values will be ignored.
Create an indicators table
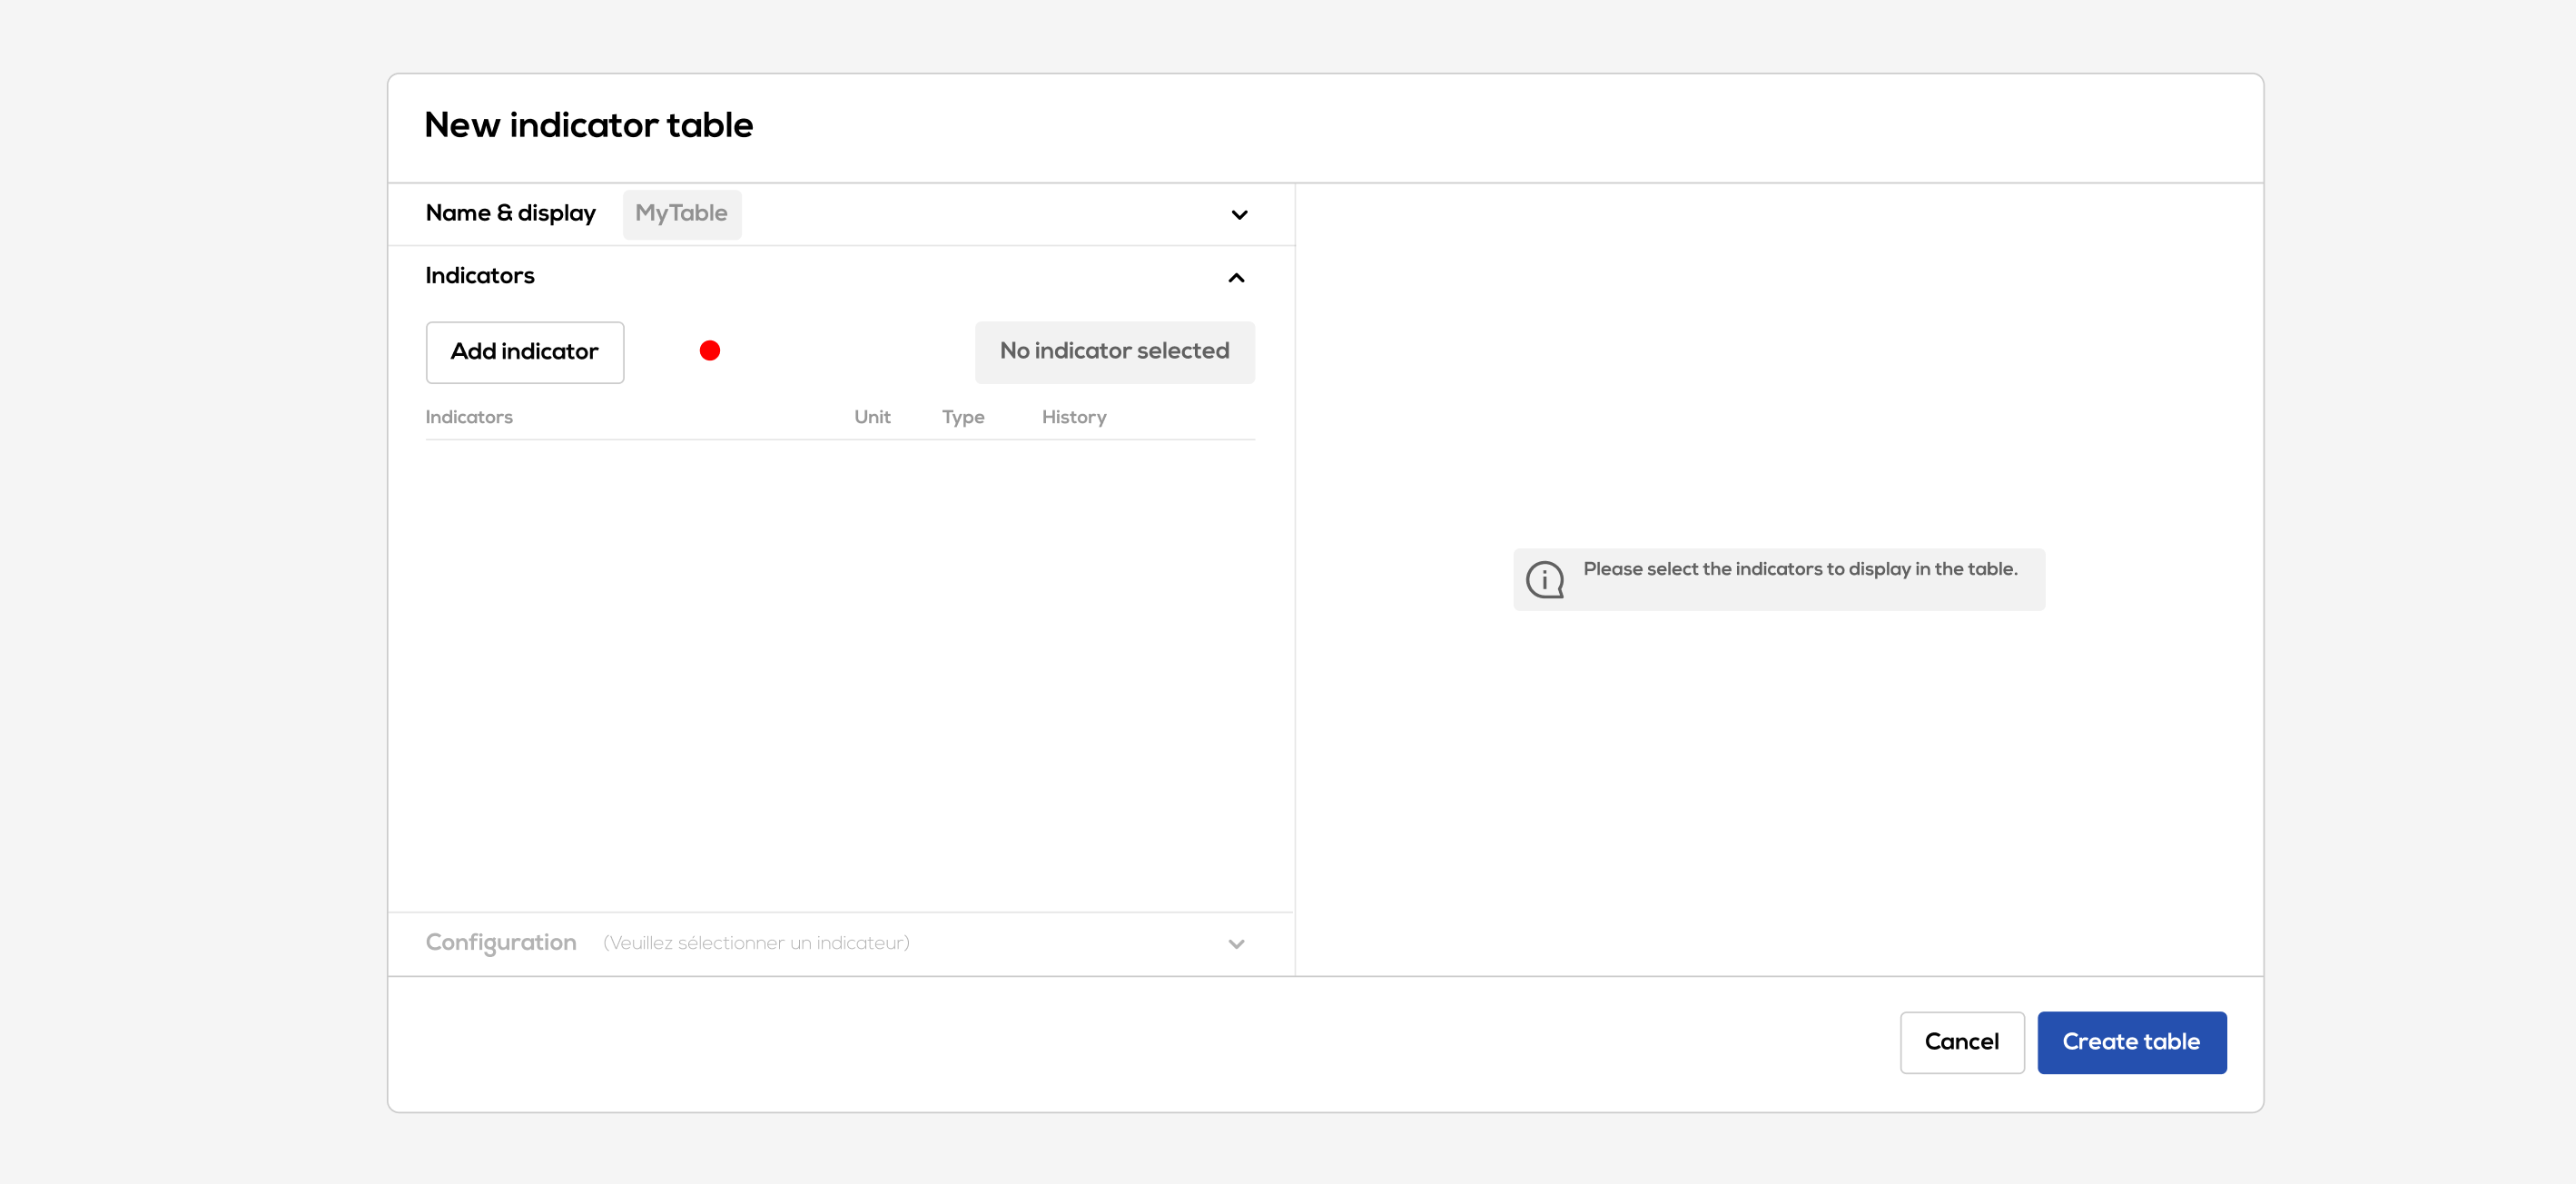
In order to create a weekly table, right click on your document background and select "New indicator view" then "Indicators table".

The new indicators table configuration window opens :
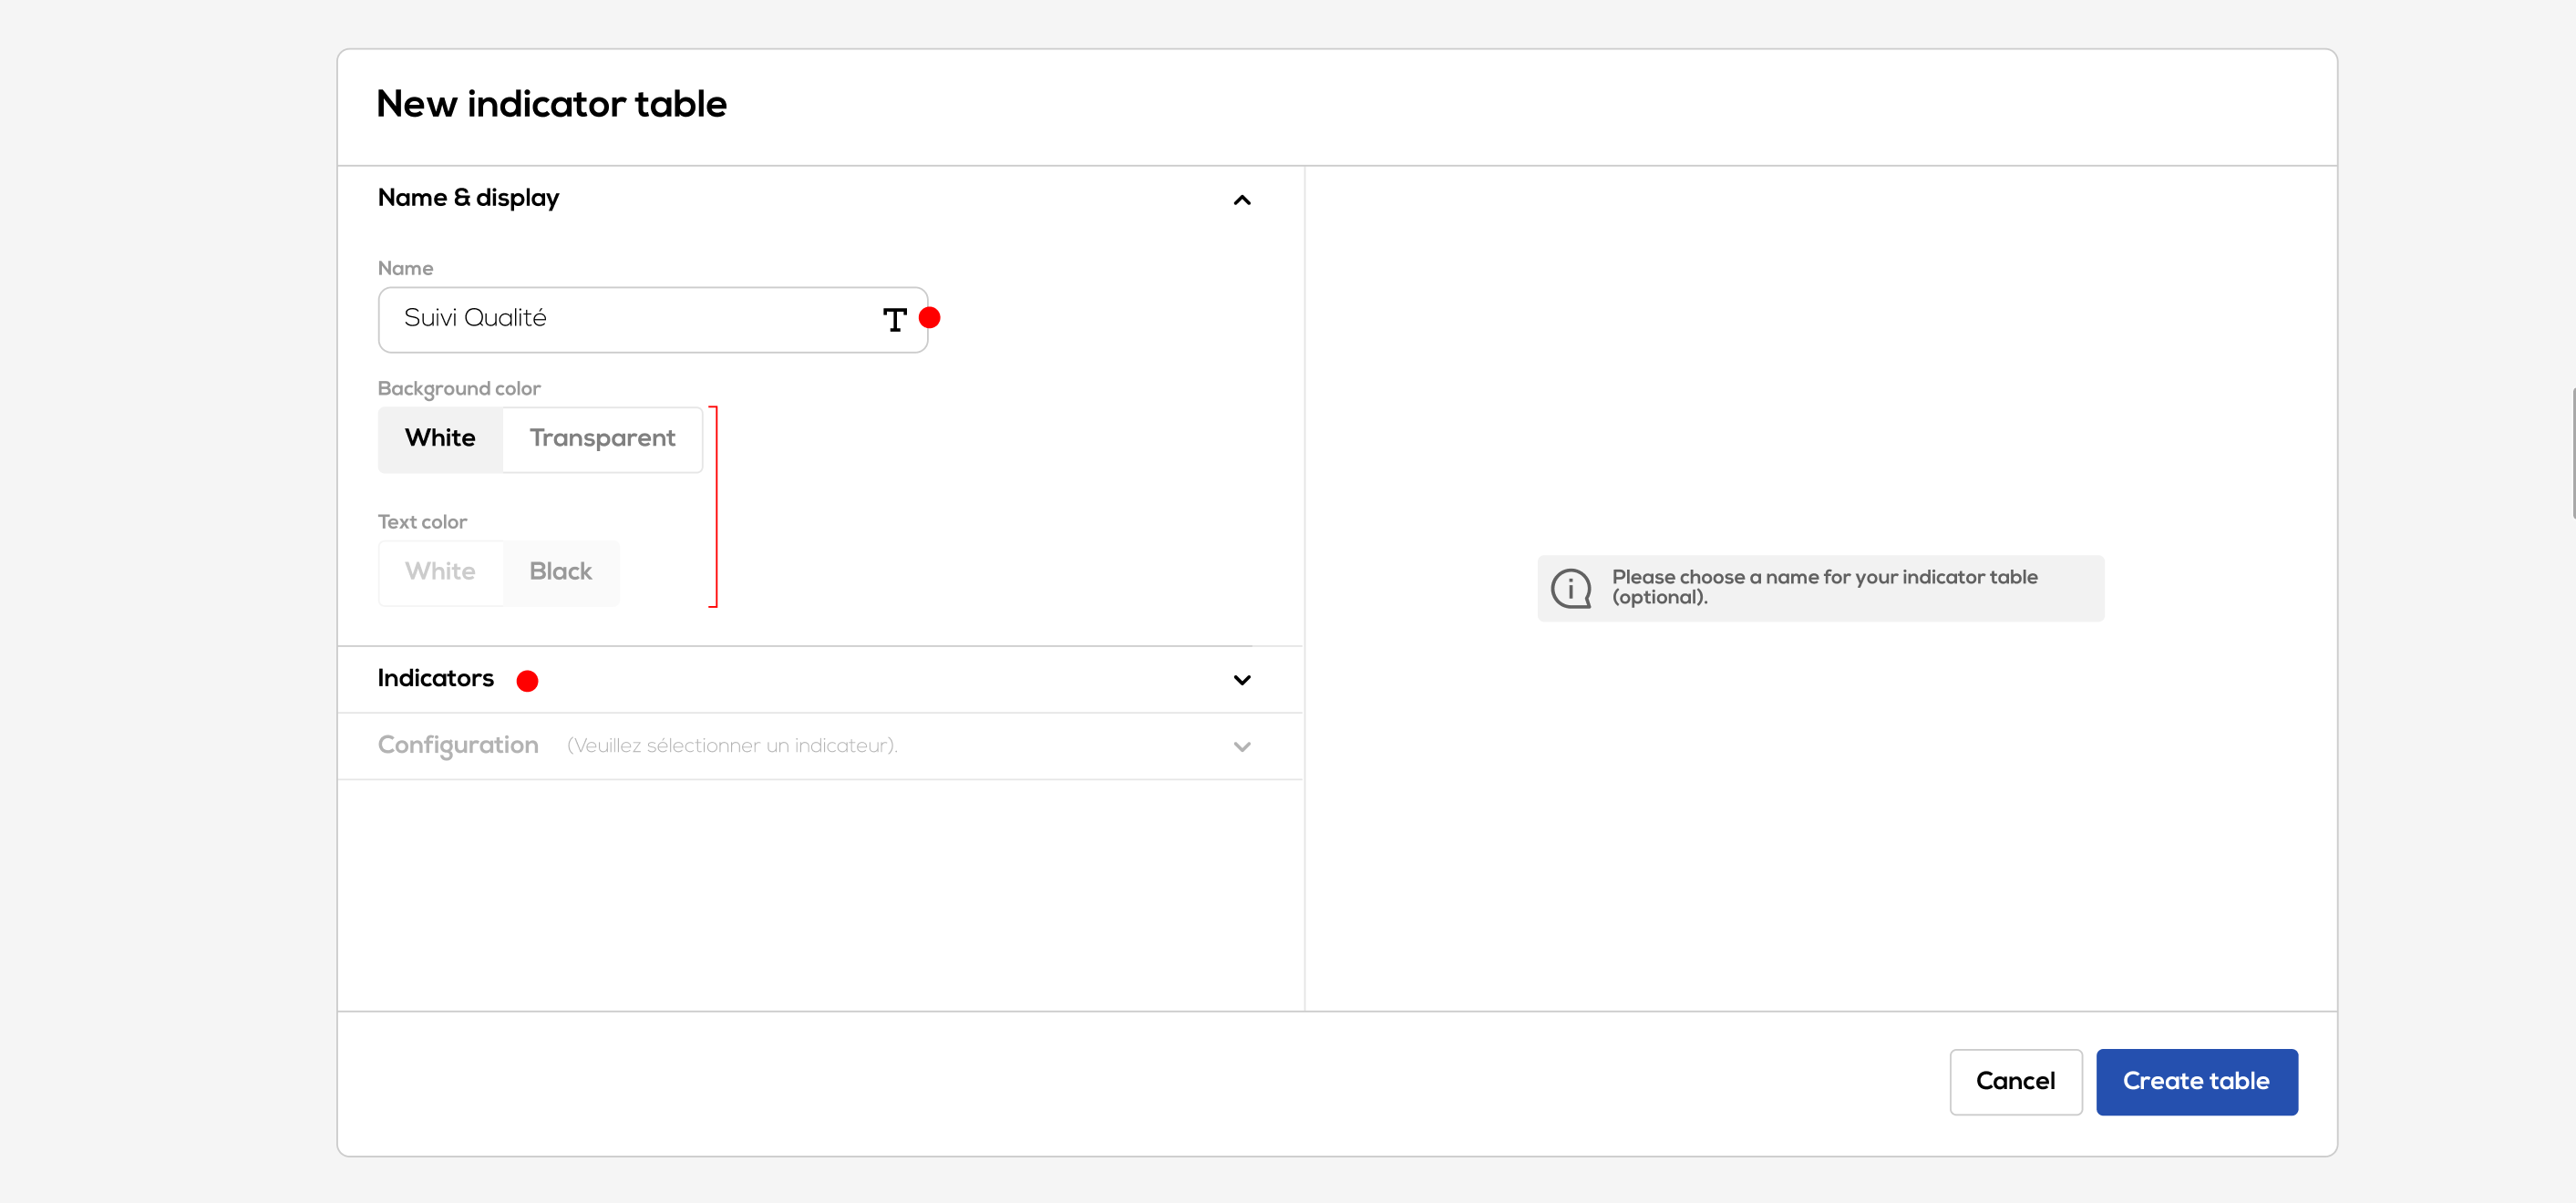
- Choose a name for your indicator table
- Choose display settings for your indicator table
Then click on "Indicators" in order to choose the indicators to display in the table :
Click on "Add indicator", the list of the project indicators opens :
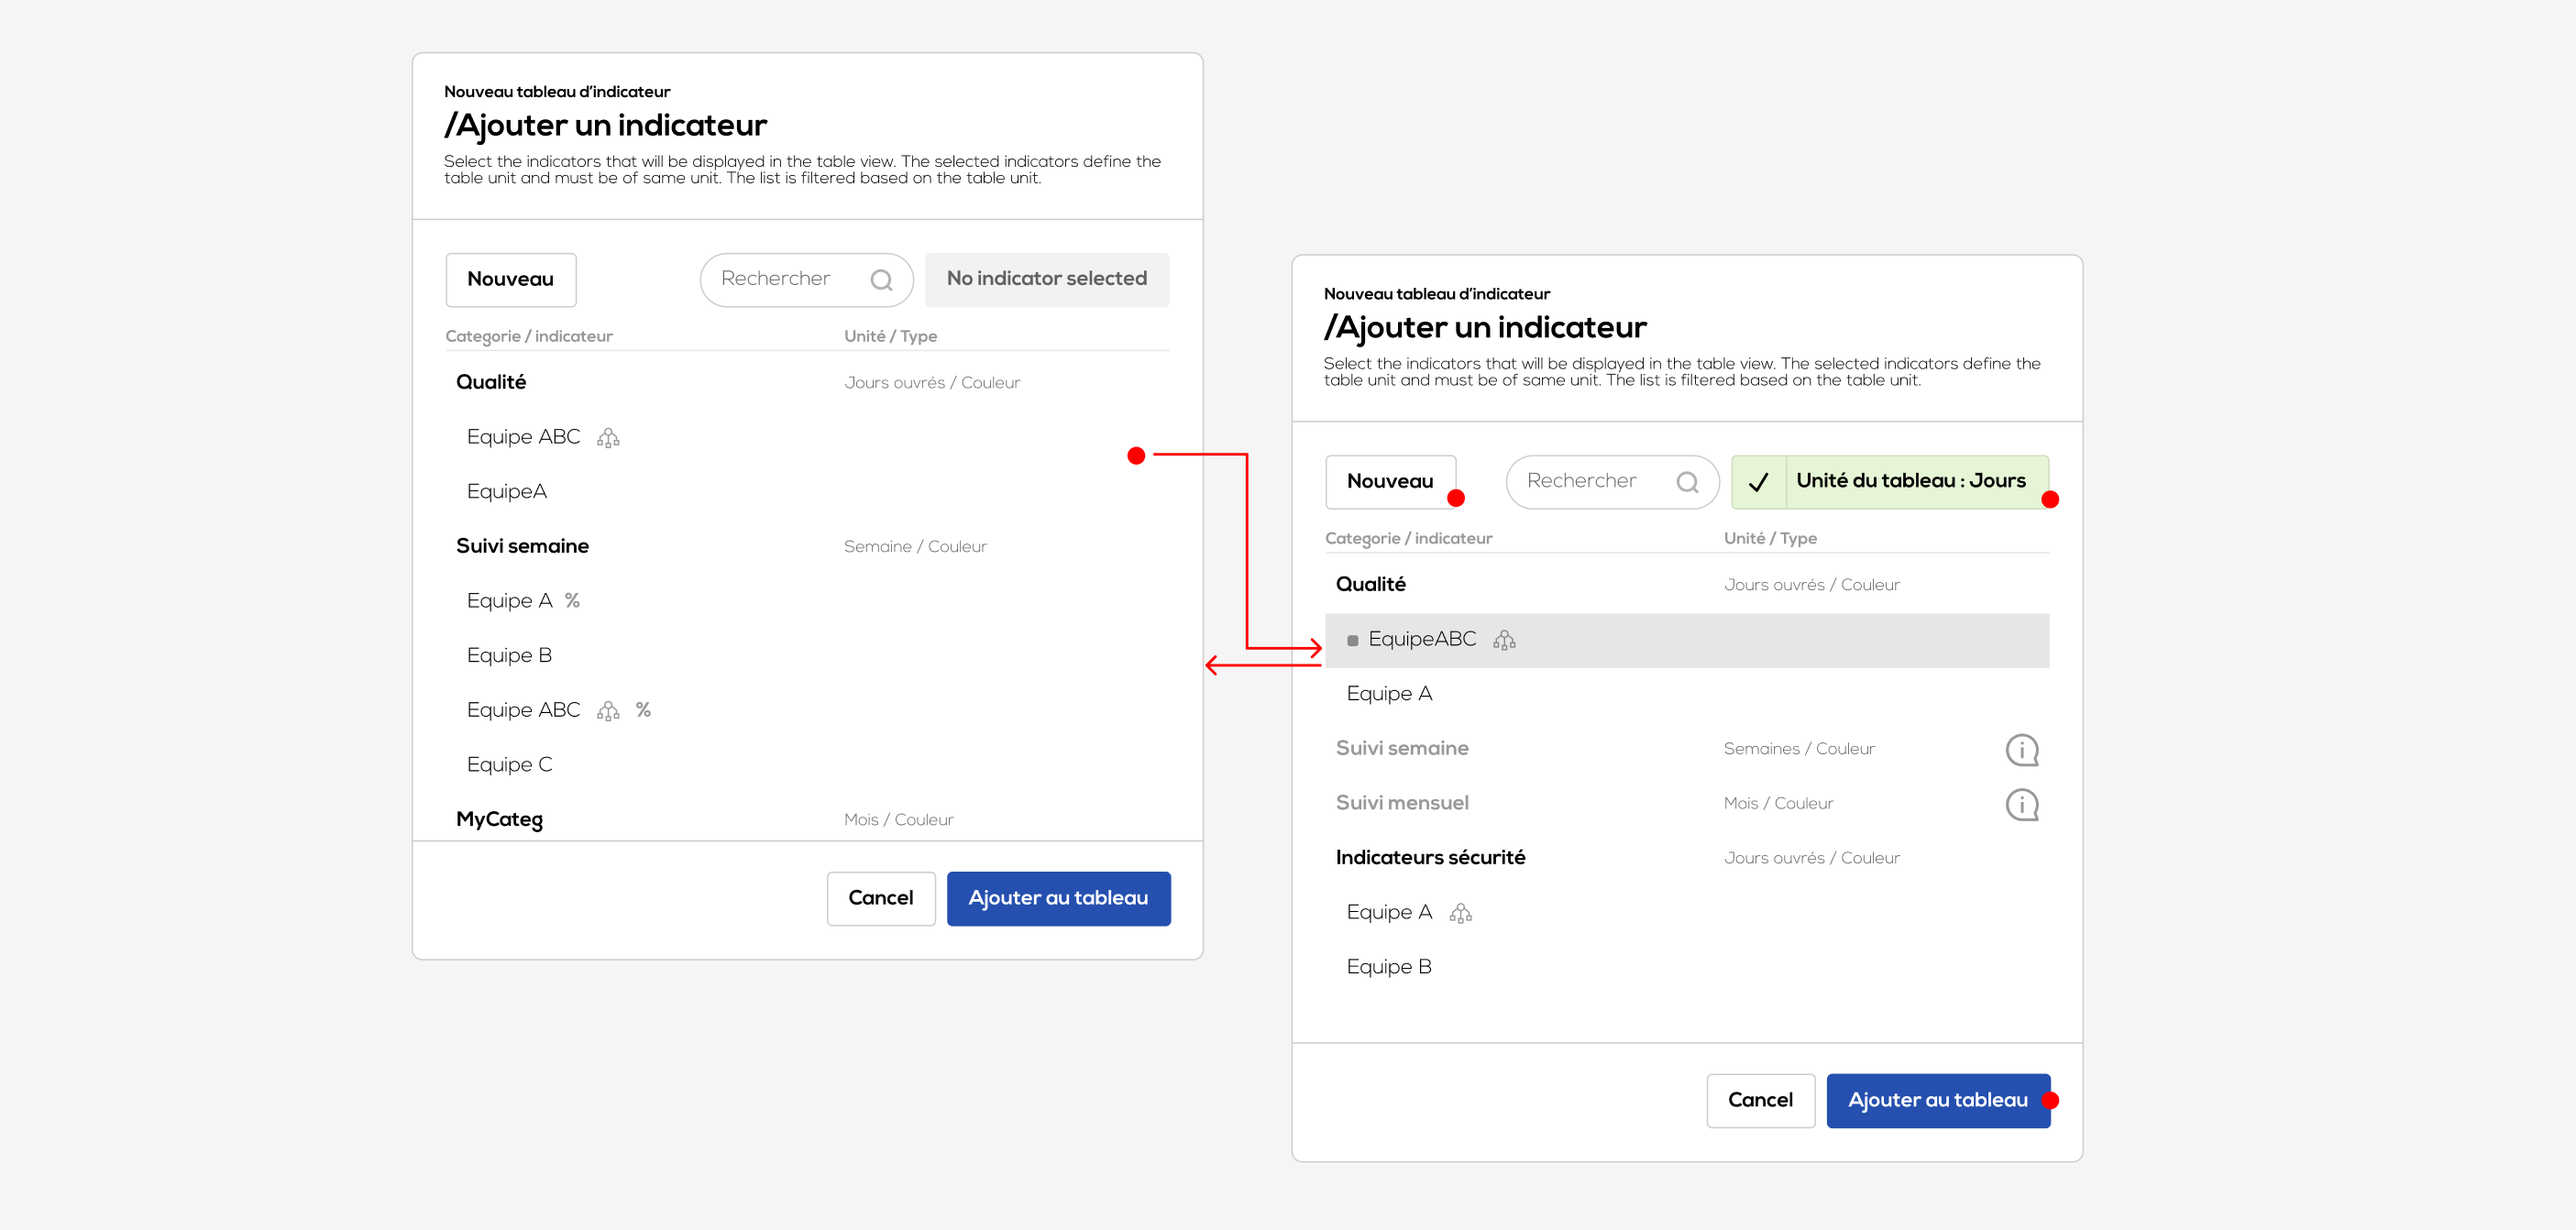
Click on one or more indicators from the list to add them to the table.
When you select the first indicator, the table automatically set its unit to the indicator unit (here days). Indicator of others units (here week and month) become unavailable in the list.
Click on "New" to create a new indicator to add to the table (see indicators).
Once the indicators are selected, click on "Add to the table" to add them to the table.
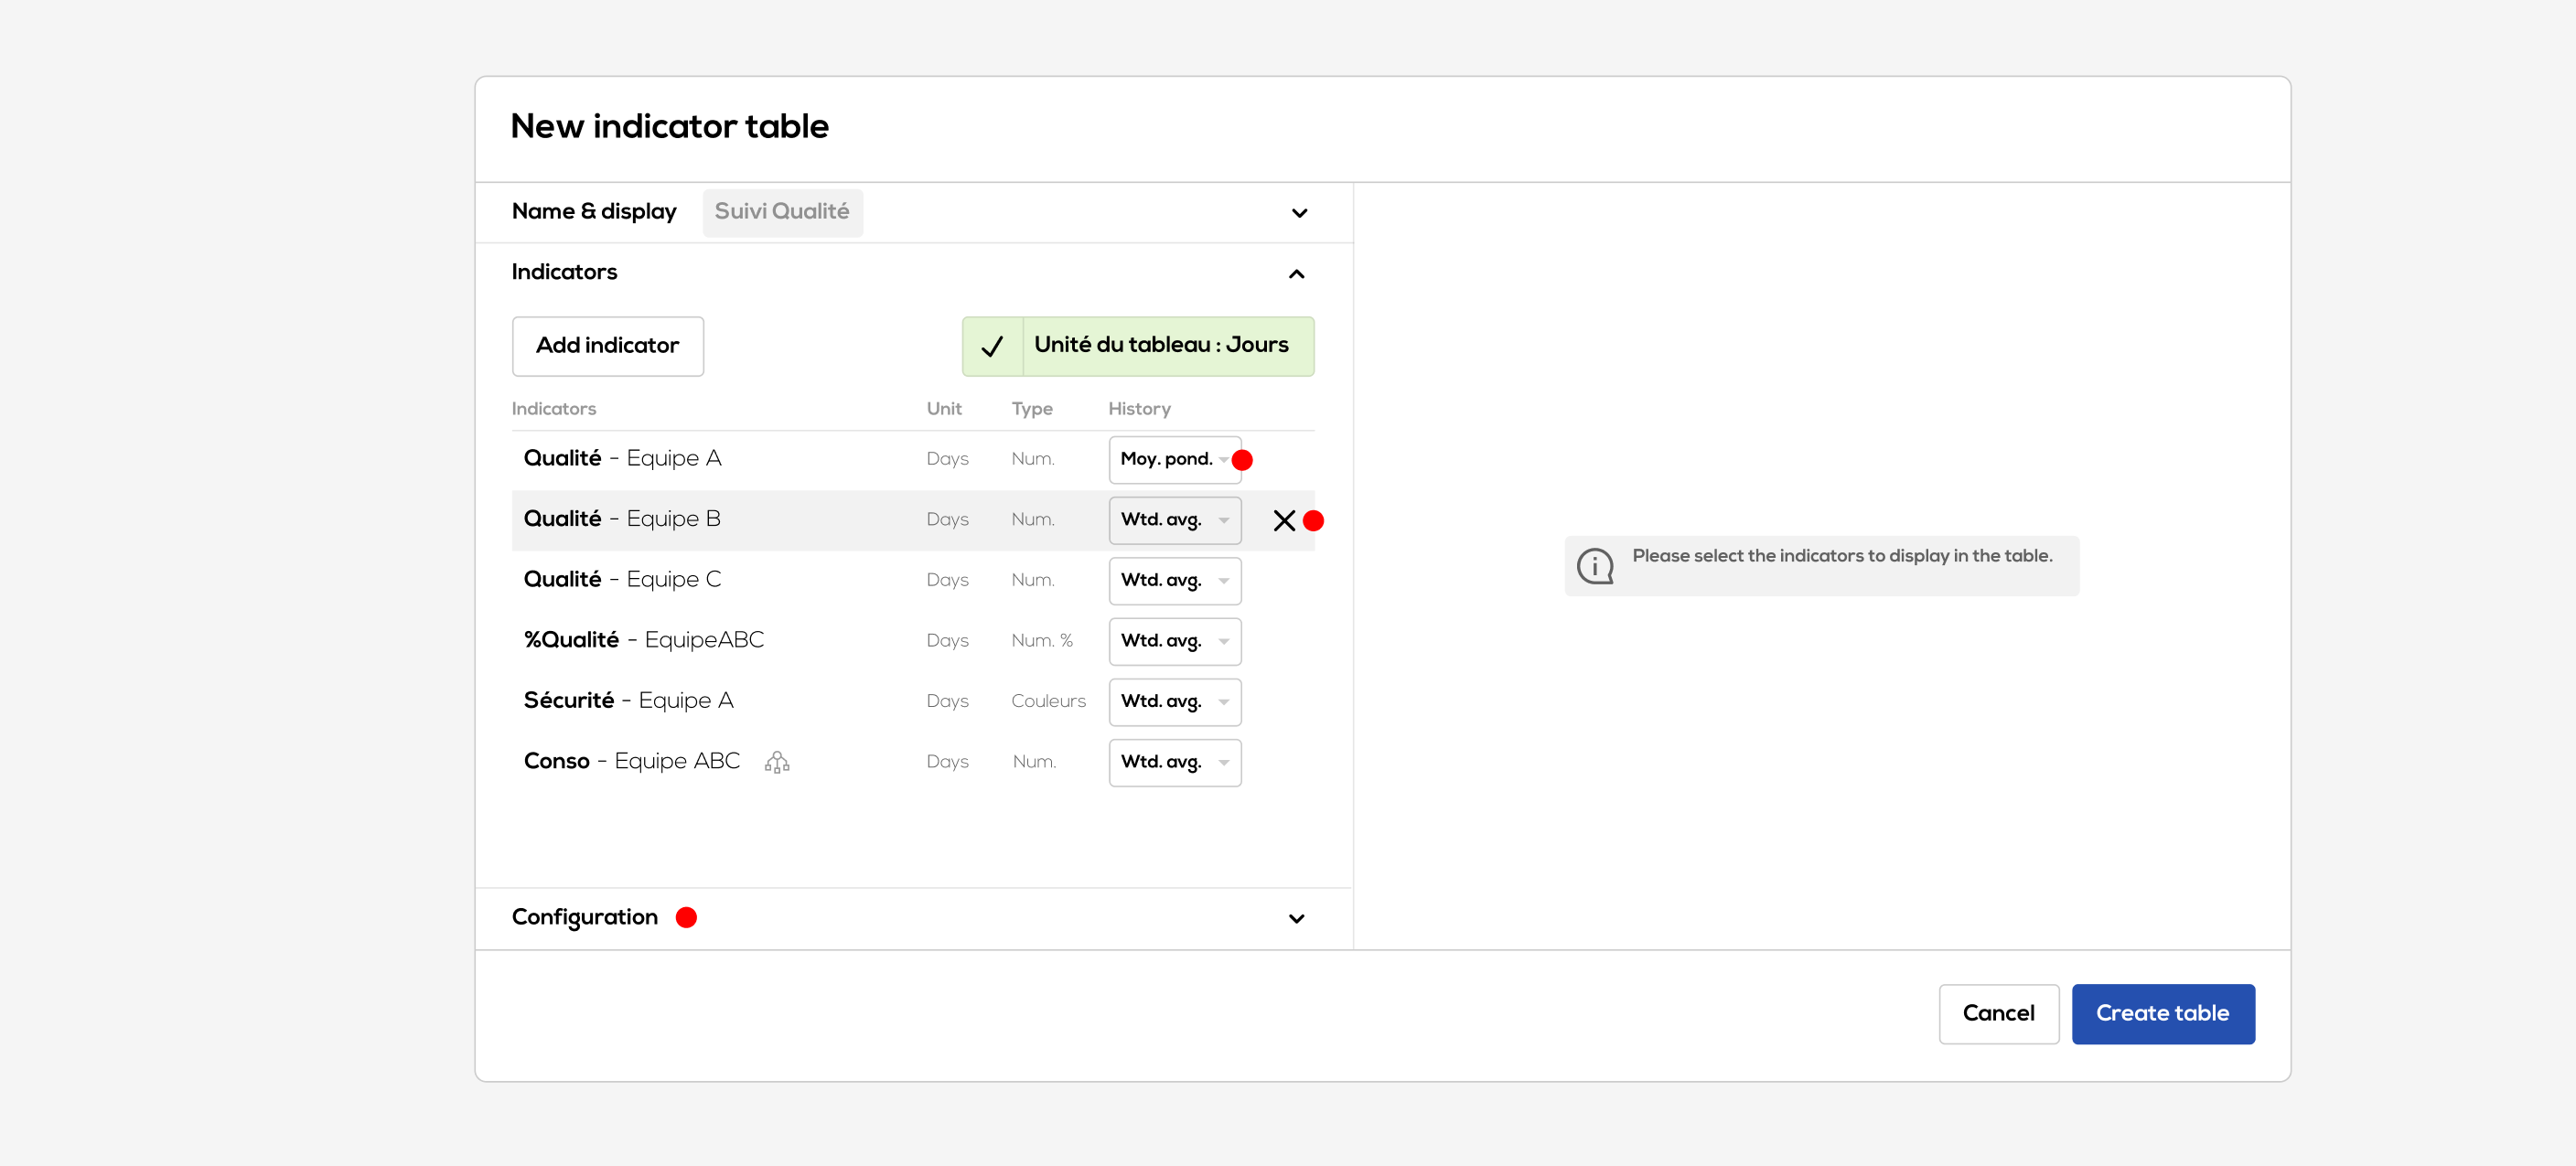
In the "Indicators" section, you can manage the table indicators list :
- Reorder the list to change the display order of the indicators in the table.
- Choose a calculation mode for current and history values of each indicator.
- Remove an indicator from the list.
Calculation mode of history and current month : for each indicator, you can choose to calculate the history using a sum, average or weighted average (only for % indicators) function.
Note : the empty results values will be ignored. The objectives values without an associated result will be ignored as well.
For a sum : result value is the sum of the results over the period, objectives values are the sum of objectives values over the period.
For an average : result value is the average of results values over the period (my = sum(realized) / number of values), objectives values are the last objective filled over the period.
For a weighted average (% indicators) : moy. pond = sum (realized) / somme (base). Objectives values are the average of the objectives over the period.
History and current of color indicators are automatically determined by criticity (the more critical color amongst the results is displayed).
Click on "Configuration" to go to next step.
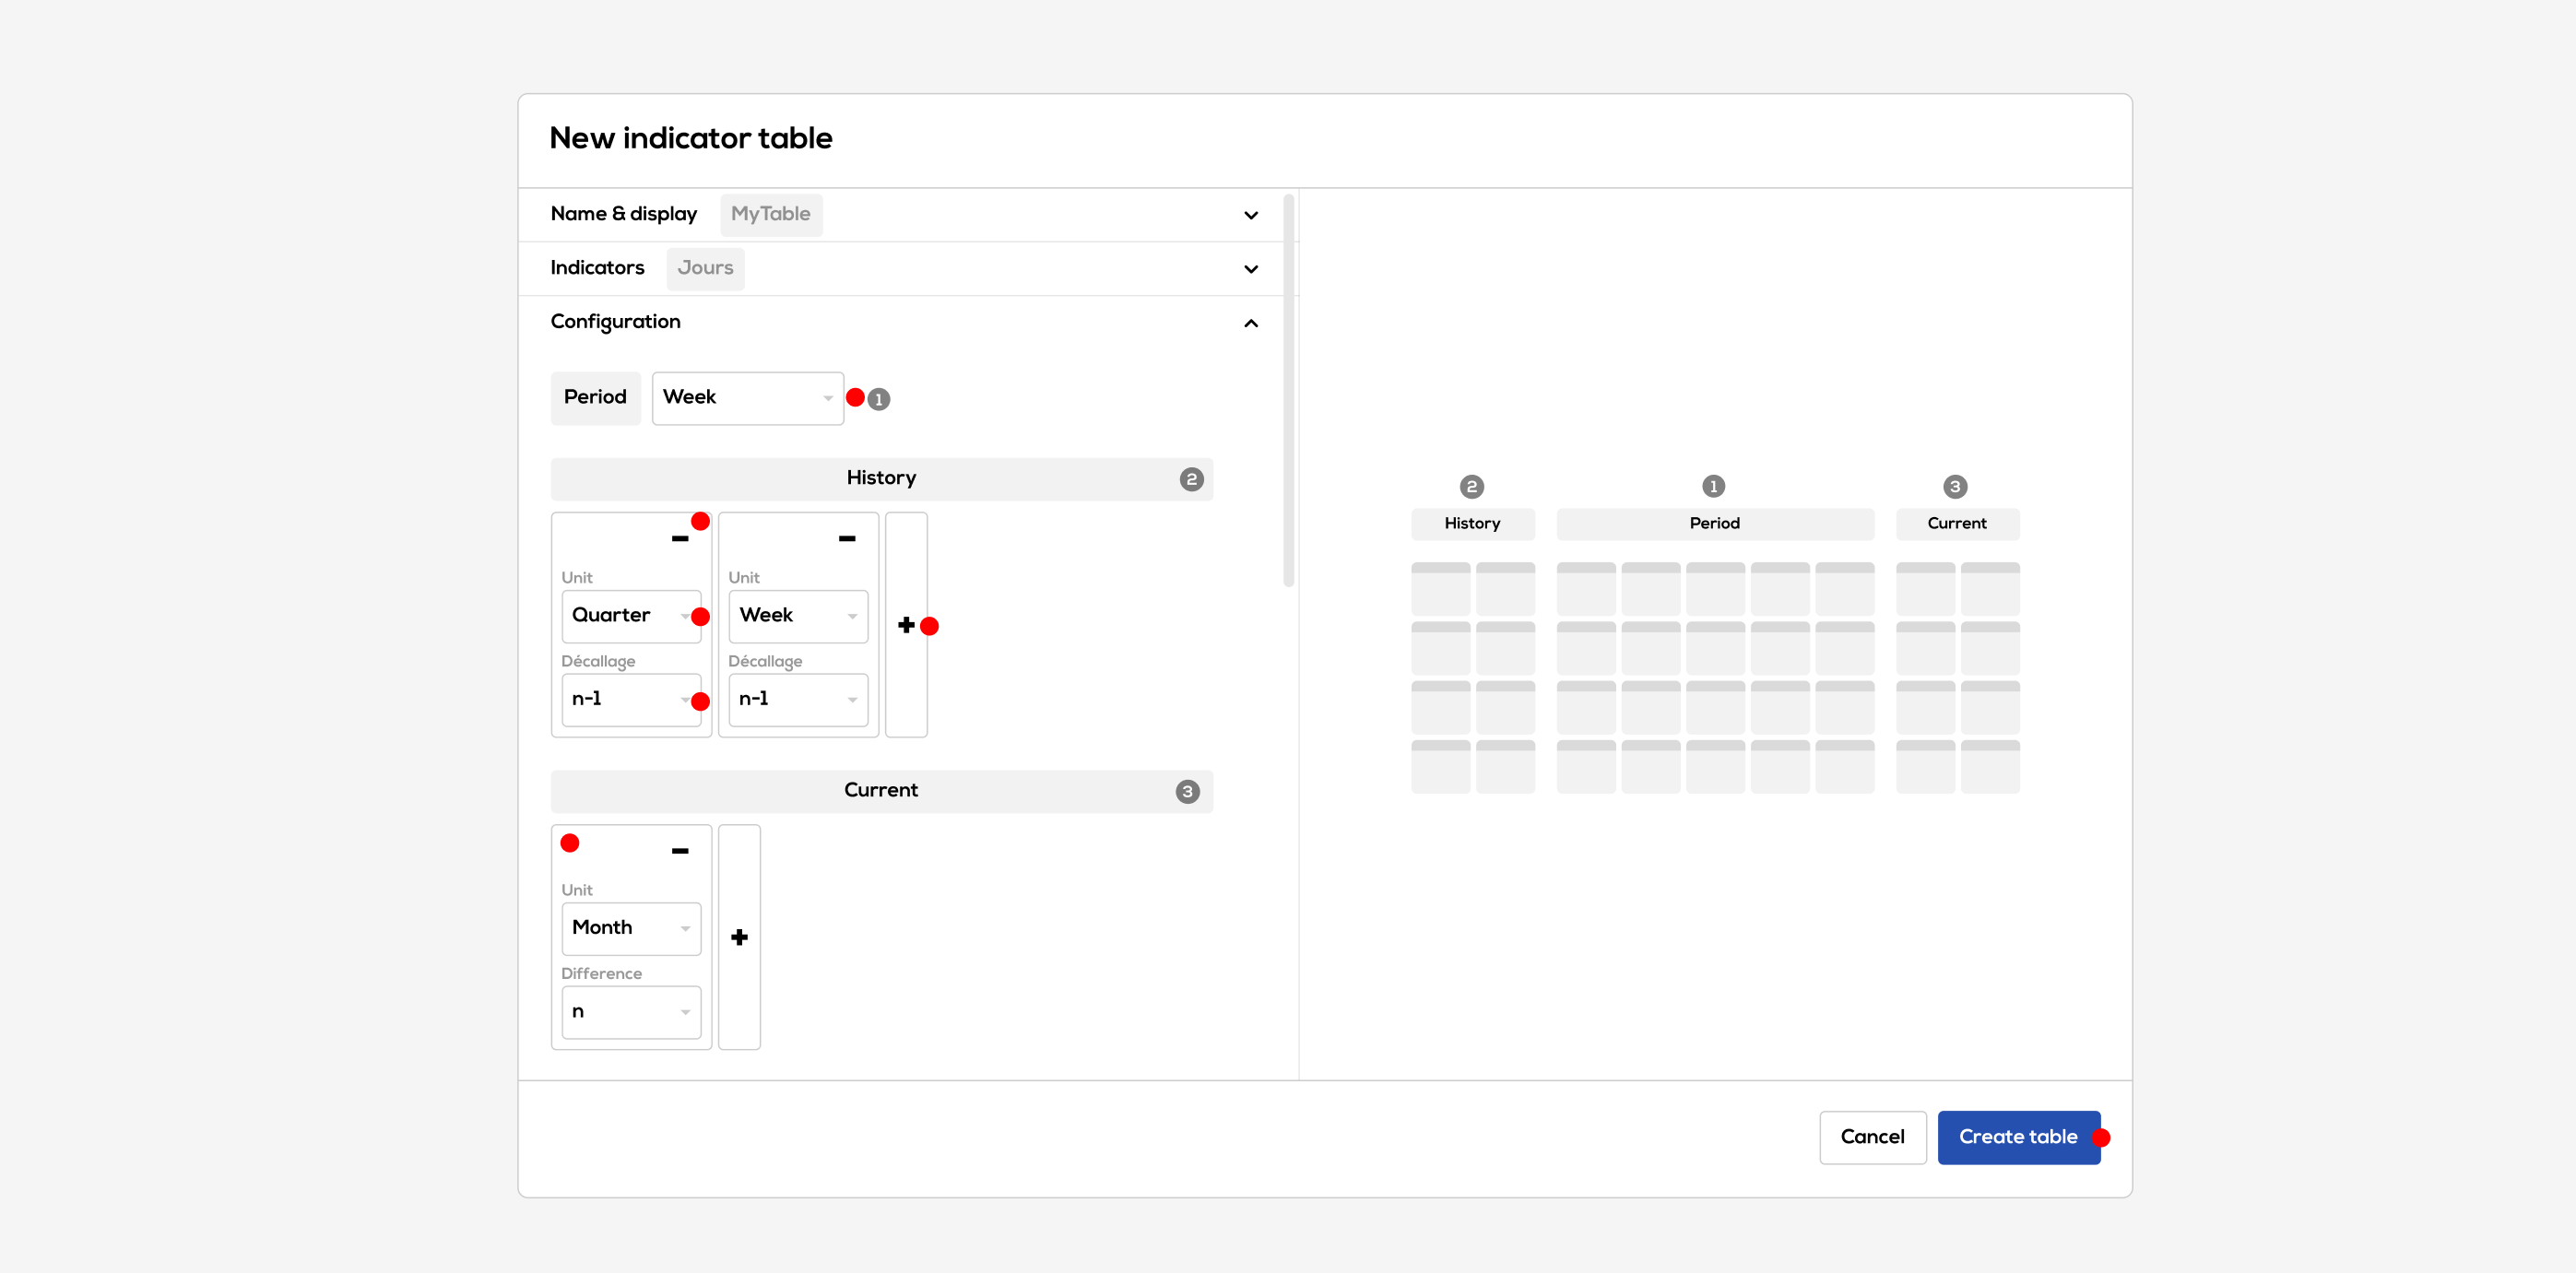
Choose the period duration.
Configure the history and current columns.
- Choose a unit and an offset for each column
- Add or remove column
- Reorder columns
If the table unit change (all indicators from the list are removed), the history and current columns configuration is reset to defaults values in order to keep compatibility between units.
Click on "Create table".
Edit indicators in a weekly table
To edit an indicator value in the weekly table, click on the corresponding cell. Please note that only weekly values can be modified: historical and current month values are automatically calculated on the basis of values entered for the period.
The value edition window opens : 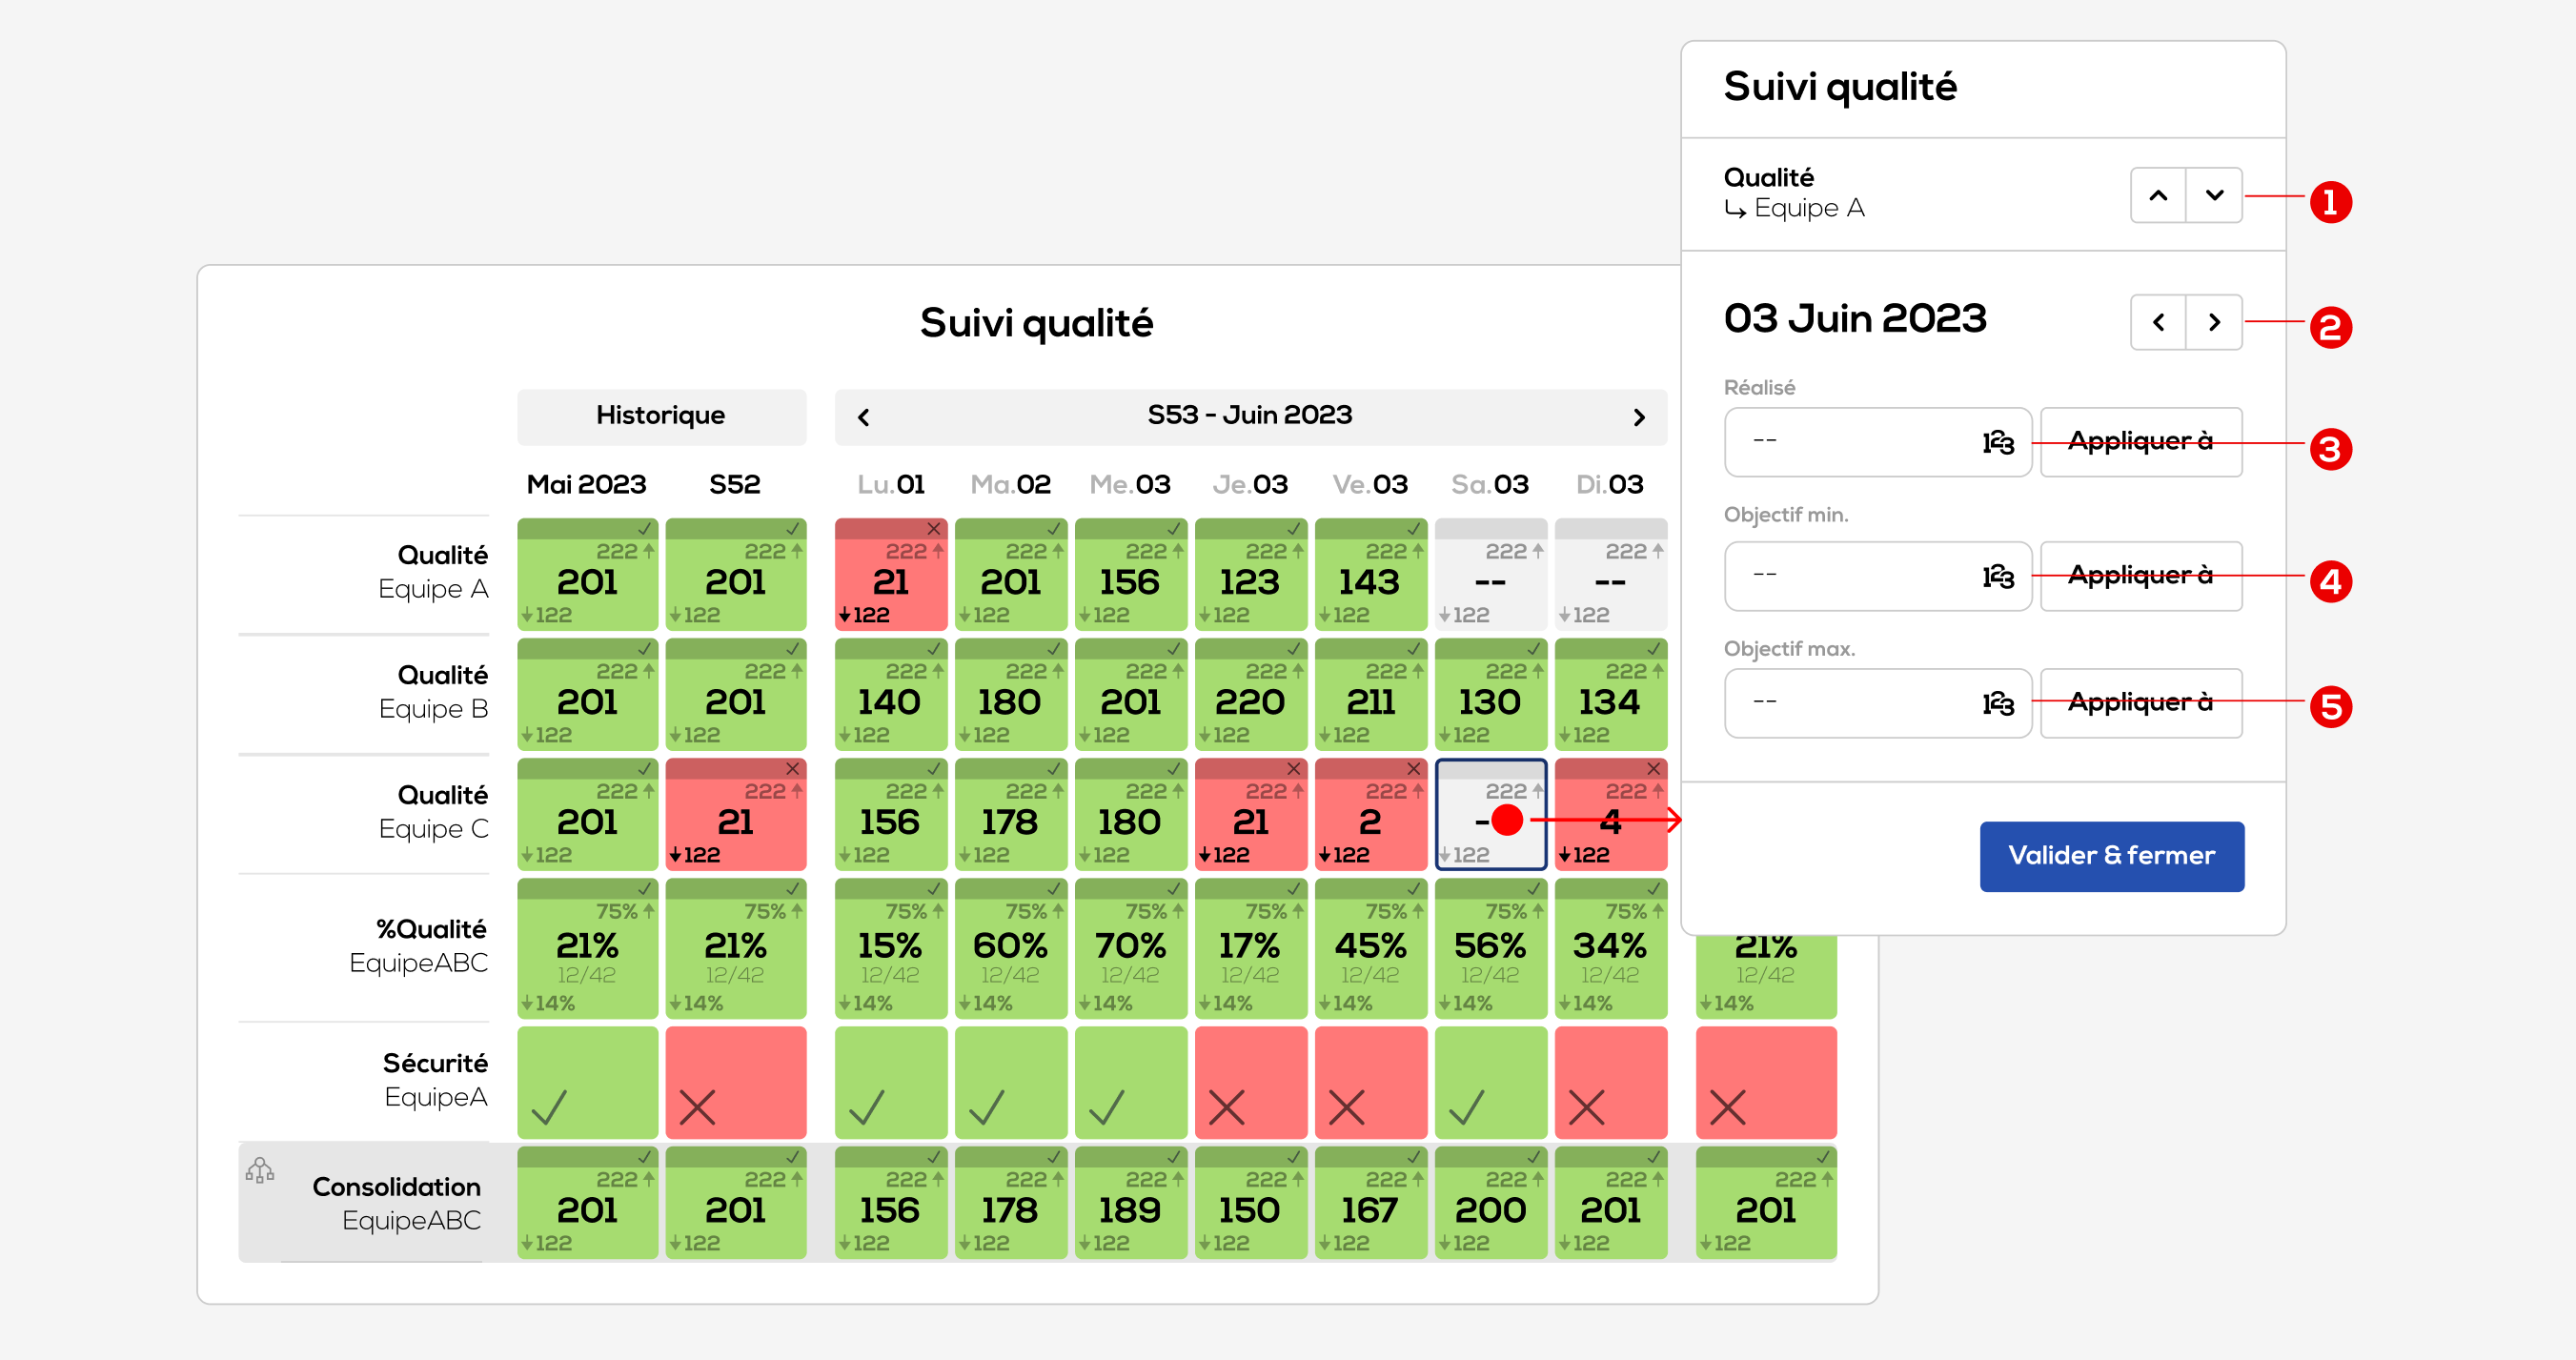
1 . Use the arrow buttons next to the date to change the date or use the shortcuts [Shift + →] or [Shift + ←].
2 . Use the arrow buttons next to the selected indicator to change indicator or use the shortcuts [Shift + ↑] ou [Shift + ↓].
3 . Result value
4 . Min objective value
5. Max objective value
"Apply to" button enable you to apply the corresponding objective value to a period of time.

Note : fields are automatically filled with a one year period starting from the selected date.
Note : if objectives values are already filled within the selected period, they will be overwritten.
The others indicator views : monthly calendar, safety cross, chart.